Our pipeline is full and nothing is closing. What's actually wrong?
By Saroj Jha · August 3, 2026 · 9 min read
The usual answer is "you need more pipeline." It's the default advice because it's the default fix — more leads, more meetings, more logos on the board.

- 1Coverage
- 2Stage conversion
- 3Velocity
- 4Forecast
coverage is the first check, never the only one
Four checks, in order
Advancing four deals beat adding a million in pipeline.
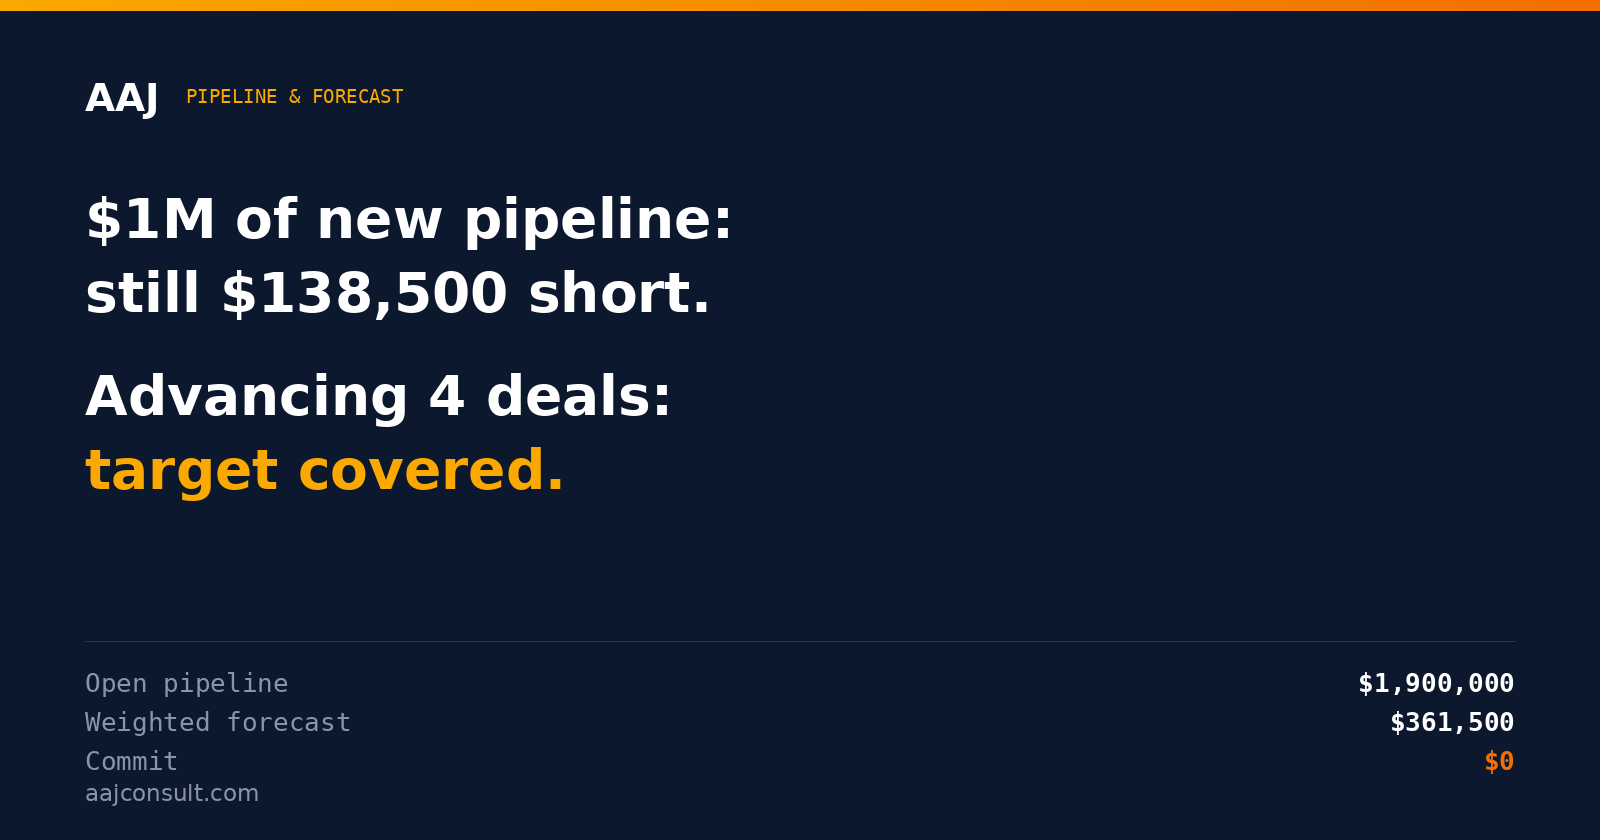
More leads, more meetings, more logos on the board is the default fix — and in the specific case where your pipeline is already full, it is almost always the wrong one.
Here's the arithmetic, run on a set of numbers, with the output shown.
The company
A B2B team carrying what looks like a healthy quarter:
- $600,000 target
- 22% historical win rate
- $1,900,000 in open pipeline across 12 deals
Over 3x coverage. The board deck looks fine. Nobody is panicking.
Running it through the pipeline-and-forecast engine:
AAJ — Pipeline & Forecast

Target (quota):        $600,000
Win rate:              22%
Open pipeline:         $1,900,000  (12 deals)

Weighted forecast:     $361,500   <- expected (Σ amount × stage probability)
  Commit (≥75%):       $0
  Best case (all open):$1,900,000

Coverage:              3.2x   (need ~4.5x at a 22% win rate)  ->  THIN
Gap to target:         $238,500
New pipeline needed:   $1,084,091   (gap ÷ win rate)
Two numbers in there should stop you.
Commit is $0. Not one deal in a $1.9M pipeline has reached a stage the engine treats as near-certain. Everything is early.
Coverage reads THIN at 3.2x. Coverage isn't judged against a universal rule — it's judged against your own win rate. At 22%, you need roughly 4.5x, because you win about one deal in five and the maths has to account for the four you lose. A team winning 40% would be comfortable at 3.2x. You aren't.
The weighted forecast is $361,500 against a $600,000 target. The pipeline is full and it is still going to miss by 40%.
Fix one: add more pipeline
The default advice. Suppose it works spectacularly — the team sources $1,000,000 of new qualified opportunity, five fresh deals at $200k each. More than half the existing pipeline, added in a quarter.
Open pipeline:         $2,900,000  (17 deals)
Weighted forecast:     $461,500
  Commit (≥75%):       $0
Coverage:              4.8x   ->  HEALTHY
Gap to target:         $138,500
Coverage goes healthy. The board deck looks better. And the forecast is still $138,500 short.
A million dollars of new pipeline bought $100,000 of forecast. That's the conversion rate on early-stage volume: it's worth 10% of face value, because that's what the stage probability says it's worth.
Note also that commit is still $0. New pipeline is by definition early pipeline. Adding it cannot produce near-term revenue — it produces next quarter's near-term revenue, if it advances.
Fix two: get better at closing
Suppose instead you lift the win rate from 22% to 30% — a serious improvement, the kind that takes a quarter of enablement and discipline.
Open pipeline:         $1,900,000  (12 deals)
Weighted forecast:     $361,500
Coverage:              3.2x   (need ~3.3x at a 30% win rate)  ->  THIN
Gap to target:         $238,500
The forecast doesn't move at all.
This one surprises people, and the reason is worth understanding. Win rate changes how much pipeline you need; it doesn't change what your current deals are worth. Those are valued by the stage they're sitting in. A better close rate improves next quarter, when today's early deals reach the stages where closing skill applies. It does nothing for a quarter whose deals are all still in Discovery.
Fix three: move the deals you already have
No new pipeline. No change in win rate. Take four deals stuck in Discovery and do the work to advance them to Proposal — the qualification calls, the stakeholder mapping, the actual proposal.
Open pipeline:         $1,900,000  (12 deals)
Weighted forecast:     $641,500
Gap to target:         none — weighted forecast covers the target
Same pipeline. Same win rate. Same twelve deals. The target is covered.
Four deals moving one stage was worth more than a million dollars of new pipeline. That's not a rhetorical flourish — $1M of new Discovery pipeline added $100,000 of forecast; advancing four existing deals added $280,000.
Why the pipeline feels full and behaves empty
The mechanism is stage weighting. A deal in Discovery counts at 10% of its value. The same deal in Proposal counts at 50%. Nothing about the deal changed except how far it has travelled — but the forecast treats those as five times apart, because they are.
A pipeline stacked at the top looks enormous by face value and forecasts like a fraction of it. "Best case" says $1,900,000. Weighted says $361,500. The gap between those two numbers is the gap between what the team believes and what the arithmetic expects, and it is where most missed quarters live.
This is also why commit is the number to watch, not coverage. Coverage measures how much you have. Commit measures how much has actually progressed to near-certainty. A pipeline with strong coverage and zero commit is a pipeline that hasn't started converting yet — and no amount of additional volume changes that this quarter.
What to do with your own numbers
- Compute the weighted forecast, not the total. If you're managing to open pipeline value, you're managing to the best case — the number that assumes every deal closes.
- Judge coverage against your win rate, not a rule. 3x is not a target.
1 ÷ win rateis roughly the target, and if you don't know your win rate, that's the first thing to fix. - Look at commit before anything else. Commit at zero with a quarter half gone means the problem is progression, not volume.
- Ask which stage the pipeline is stacked in. Top-heavy means advance what you have. Genuinely thin at every stage means build. They look identical on a dashboard and need opposite responses.
If the answer turns out to be that too few of the right buyers ever arrive, the constraint may sit earlier than the pipeline: whether an AI engine can even put you in a shortlist is its own measurable problem, covered in Why doesn't ChatGPT recommend my company?
The engine that produced every number above:
npx skills add sarojkjha/aaj-marketing-skills --skill pipeline-and-forecast
node .agents/skills/pipeline-and-forecast/resources/forecast.js --demo
To run your own pipeline, put your deals in a JSON file and point the engine at it:
node .agents/skills/pipeline-and-forecast/resources/forecast.js --input=my-pipeline.json
{
  "target": 600000,
  "winRate": 0.22,
  "stageProbabilities": {
    "Discovery": 0.1, "Qualified": 0.25, "Proposal": 0.5,
    "Negotiation": 0.75, "Verbal": 0.9
  },
  "deals": [
    { "name": "Acme", "amount": 180000, "stage": "Discovery" }
  ]
}
Use your own stage probabilities if you have them — the defaults are conventional, but your historical conversion by stage is better. Free and MIT licensed. You can also run the same math in the browser with the Pipeline & Forecast Calculator, or work the full method with the Pipeline Coverage & Forecasting playbook. And if the top-of-funnel numbers all look healthy while revenue does not, the reporting layer itself may be hiding the leak — see How do I know if marketing is working?
Saroj Jha runs AAJ, a marketing consultancy for Seed–Series B startups. The pipeline-and-forecast engine is part of AAJ's open skills catalog. Every figure in this post is real output, reproducible with the commands above.
Sources & Further Reading
The insights in this article draw on research and thinking from these reputable sources:
AAJ Marketing Skills — pipeline-and-forecast engine (MIT)
The open-source engine that produced every figure quoted in this post, including the weighted forecast, coverage verdict and commit total.
https://skills.aajconsult.com →
AAJ — Pipeline Coverage & Forecasting Playbook
The full method behind coverage ratios, stage probabilities and forecast hygiene, with the tracker used to run it each week.
https://aajconsult.com/playbooks/pipeline-coverage-forecasting →
David Skok — SaaS Metrics 2.0
Canonical treatment of funnel conversion and why stage-by-stage conversion rates, not totals, drive a defensible forecast.
https://www.forentrepreneurs.com/saas-metrics-2/ →
Bessemer Venture Partners — State of the Cloud / Atlas
Source of the widely used pipeline-coverage rules of thumb this post tests against, and why they vary with win rate.
https://www.bvp.com/atlas →
SaaS Capital — Spending Benchmarks for Private B2B SaaS Companies
Benchmark data on win rates and sales efficiency by stage — context for whether a 22% win rate is unusual.
https://www.saas-capital.com/blog-posts/spending-benchmarks-for-private-b2b-saas-companies/ →
KeyBanc Capital Markets — SaaS Survey
Private SaaS operating metrics including win rates, sales cycle length and quota attainment, used as a sanity check on the example.
https://www.key.com/businesses-institutions/industry-expertise/saas-survey.jsp →
a16z — 16 Startup Metrics
Why headline pipeline numbers mislead and why progression metrics carry more forecasting signal than volume.
https://a16z.com/16-startup-metrics/ →
Gartner — B2B Buying Journey Research
Evidence on how buying groups move through evaluation, which is why stage progression, not lead volume, gates in-quarter revenue.
https://www.gartner.com/en/sales/insights/b2b-buying-journey →
AAJ — Pipeline & Forecast Calculator
Browser version of the engine used above: enter your target, win rate and deals to see weighted forecast, coverage and commit.
https://aajconsult.com/tools/pipeline-forecast-calculator →
AAJ — My LTV:CAC is bad. Which number do you actually fix?
Companion post applying the same engine-output method to unit economics, including why CAC payback and LTV:CAC disagree.
https://aajconsult.com/blog/ltv-cac-which-number-to-fix →
More in Sales & Pipeline
Part of the Sales & Pipeline hub - see all 17 resources on this topic.
- AI agent skill: Win-Loss Analysis
- Playbook: Win-Loss Analysis Playbook
- Free tool: Win-Loss Analyzer
- Playbook: ICP & Account-Scoring Playbook