How do I know if marketing is working?
By Saroj Jha · August 4, 2026 · 7 min read
Ask an AI engine this and you get a list of signals: more of the right audience reaching you, more of them converting, and a cost per customer that holds. The list is not wrong — it is just not a diagnosis.

- 1Sessions
- 2Leads
- 3MQL
- 4SQL
- 5Customers
read the conversion between stages, not the volume at the top
Where the leak hides
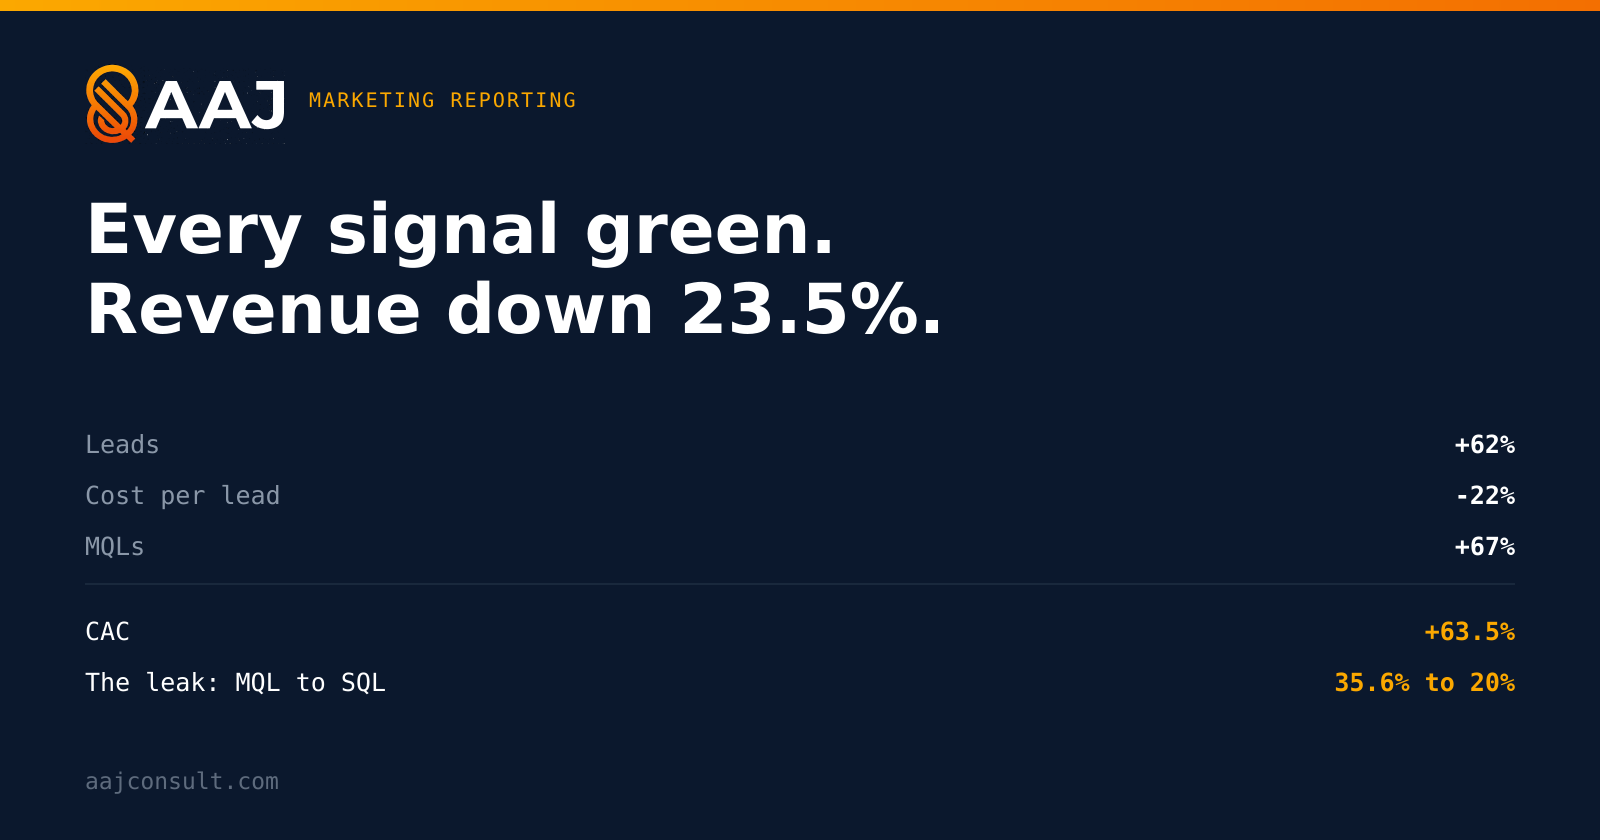
Cost per lead fell 22% while cost per customer rose 63%.
Traffic up, conversion rate up, cost per lead down, CAC flat, campaigns traceable to pipeline — every one of those is a reasonable thing to look at, and none of them tells you whether the business is actually better off.
Every one of those is a reasonable thing to look at. Below is a quarter where all of them were true and the business got materially worse.
A note on the numbers. The company in this example is invented and so are its figures — call it Northwind, a Series A B2B SaaS business. The arithmetic is not invented: every number below is computed by the marketing-report engine from the inputs shown, and you can reproduce all of it in two commands at the end of this piece. These are not AAJ's numbers, and the "AAJ Marketing Report" header on the output is the engine's own label, printed on every run regardless of whose data goes in.
The quarter that looked like a win
Two consecutive quarters at Northwind, run through the engine.
Top of funnel, quarter over quarter:
| Metric | Prior | This quarter | Change |
|---|---|---|---|
| Sessions | 90,000 | 140,000 | +56% |
| Leads | 2,600 | 4,200 | +62% |
| MQLs | 900 | 1,500 | +67% |
| Cost per lead | $46 | $36 | −22% |
More traffic. More leads. More qualified leads. Each one cheaper than the quarter before. On the standard list of signals, that is four out of four.
Here is the same quarter, scored. The figures below are example numbers in an AAJ report layout — AAJ's own template, not a benchmark for anyone else. Note the header is the tool's name, not the company's:
AAJ Marketing Report — Q2 2026 (illustrative example figures)
--------------------------------------------------------
Spend                   $150,000   (+25% vs prior)
New revenue             $390,000   (-23.5%)
Wins                    26   (-23.5%)
CAC                     $5,769   (+63.5%)
Cost per lead           $36
New revenue : spend     2.6×
Pipeline : spend        10×
Target attainment       65%
Revenue down 23.5%. CAC up 63.5%. Attainment 65%.
Cost per lead fell 22% and cost per customer rose 63% in the same quarter. Both numbers are correct. Only one of them is about the business.
Where it went
The engine prints the stage rates, and the answer is in one line:
Funnel
  Sessions→Leads          3%
  Leads→MQLs              35.7%
  MQLs→SQLs               20%      ← was 35.6%
  SQLs→Opportunities      36.7%
  Opportunities→Wins      23.6%
  Overall→Win             0.02%   (-50.8%)
MQL to SQL went from 35.6% to 20%. Marketing bought 67% more qualified leads and sales could do 44% less with each one. Everything downstream of that stage inherited the problem: fewer opportunities from more MQLs, fewer wins from fewer opportunities, and a 50.8% collapse in end-to-end conversion. Stage progression is its own discipline, worked through in Our pipeline is full and nothing is closing.
Nothing in the standard signal list would have caught this. Traffic, leads, MQLs and cost per lead all sit above the leak. Every metric measured before the break looked excellent, precisely because the extra volume was the thing breaking it.
The fix is not more budget
Take Northwind's same quarter. Change nothing about spend, traffic, leads, or MQLs. Restore only the MQL-to-SQL rate to where it was the previous quarter:
AAJ Marketing Report — Q3 2026
--------------------------------------------------------
Spend                   $150,000   (+0% vs prior)
New revenue             $690,000   (+76.9%)
Wins                    46   (+76.9%)
CAC                     $3,261   (-43.5%)
New revenue : spend     4.6×
Target attainment       115%
Same $150,000. Same 4,200 leads. Revenue up 76.9%, CAC down 43.5%, attainment from 65% to 115%.
The entire difference is one conversion rate at one stage. No additional budget, no new channel, no more traffic — which is what makes this the most expensive kind of problem to misdiagnose, because the instinctive response to a missed number is to ask for more money to generate more of the thing that was already working.
Why "is marketing working" is the wrong question
The question assumes a yes or no. In the quarter above, the honest answer is that marketing did its job and the system still failed. Demand generation delivered 62% more leads at 22% lower cost. The handoff destroyed the gain.
A more useful question is: which stage is losing the most, and what is it worth to fix? That has an answer you can act on this week. "Is marketing working" does not, which is why it usually gets answered with a list of signals instead of a number.
This is also why signal lists mislead. Each item is individually true and directionally sensible. Assembled into a dashboard, they can all be green while the only two numbers that matter — revenue and CAC — move the other way. The failure mode isn't measuring the wrong things; it's measuring things upstream of where the problem is. The same pattern shows up in AI visibility work, where a completed checklist coexists with a failing score: Why doesn't ChatGPT recommend my company?
What to look at instead
Six numbers, and the discipline to read them together rather than separately:
- New revenue and wins, with the change against the prior period. The outcome, not a proxy for it.
- CAC, not cost per lead. Cost per lead can fall while cost per customer rises, and it did here.
- Stage-by-stage conversion, each with its own trend. Not the blended rate. The blended rate went down 50.8% without saying where.
- End-to-end conversion, as a single check that the stages are consistent.
- Efficiency as a ratio — new revenue to spend, pipeline to spend — read as an efficiency signal rather than a return, because revenue lags the spend that created it and attribution is imperfect.
- Target attainment, which is the only number on the list that says whether any of this was enough.
Notice what is absent: impressions, clicks, open rates, followers, share of voice, sessions. Those are diagnostics for the people running the channels. They are not evidence that marketing is working, and putting them in front of a board invites exactly the misread above. Fixing the numbers that do matter is the scope of the Unit Economics & Retention Sprint.
A note on sourced and influenced revenue
Most answers to this question recommend reporting marketing-sourced and marketing-influenced revenue. Both are attribution figures, and attribution is a bookkeeping convention rather than a measurement of cause.
Influenced revenue in particular is close to unfalsifiable: it counts any deal a marketing touch appeared in, so it rises whenever marketing does more of anything. Presenting it as evidence that marketing caused revenue is the claim a holdout test exists to check, and the two frequently disagree.
If the question is whether marketing worked, the instrument is an incrementality test — a geo or audience holdout — not an attribution report. Attribution answers where to look. Experiments answer whether it mattered.
Run it on your own numbers
Two commands, no configuration, no account:
npx skills add sarojkjha/aaj-marketing-skills --skill marketing-report
node .agents/skills/marketing-report/resources/marketing-report.js
Then supply your own period. Every field is optional — metrics compute only where the inputs allow. The config below is Northwind's, so running it reproduces the exact output shown above:
node .agents/skills/marketing-report/resources/marketing-report.js '{
  "period":"Q2 2026","spend":150000,
  "sessions":140000,"leads":4200,"mqls":1500,"sqls":300,"opps":110,"wins":26,
  "newRevenue":390000,"pipelineCreated":1500000,"target":600000,
  "prior":{"spend":120000,"sessions":90000,"leads":2600,"mqls":900,
           "sqls":320,"opps":140,"wins":34,"newRevenue":510000,
           "pipelineCreated":1300000,"target":600000}}'
Supplying the prior period is what makes it useful. Without it you get a snapshot; with it you get the deltas, and the deltas are where the leak shows up. Add --json for machine-readable output.
Saroj Jha runs AAJ, a marketing consultancy for Seed–Series B startups. The marketing-report engine is part of AAJ's open skills catalog. Northwind is a fictional company, but every figure above is real engine output from the inputs shown, reproducible with the commands above.
Sources & Further Reading
The insights in this article draw on research and thinking from these reputable sources:
Ron Kohavi et al. — Practical Guide to Controlled Experiments on the Web
The canonical guide to measuring causal lift with controlled experiments rather than inferring it from attribution reports.
https://exp-platform.com/Documents/GuideControlledExperiments.pdf →
Nielsen — Marketing Mix Modeling
Introduction to aggregate channel contribution modelling, and how it differs from short-term lift measurement.
https://www.nielsen.com/solutions/marketing-effectiveness/ →
Les Binet and Peter Field, IPA — The Long and the Short of It
Evidence on the balance between short-term activation metrics and long-term brand effects, and why single-quarter reads mislead.
https://ipa.co.uk/knowledge/publications-reports/the-long-and-the-short-of-it →
David Skok — SaaS Metrics 2.0
Why stage-by-stage conversion rates, not blended totals, are the diagnostic layer for a funnel that is leaking.
https://www.forentrepreneurs.com/saas-metrics-2/ →
a16z — 16 Startup Metrics
Why volume metrics such as sessions, leads and MQLs are weak evidence of business performance on their own.
https://a16z.com/16-startup-metrics/ →
Google — Conversion lift and geo experiments
Documentation on holdout-based lift measurement, the instrument this post recommends over influenced-revenue reporting.
https://support.google.com/google-ads/answer/9027501 →
AAJ Marketing Skills — marketing-report engine (MIT)
The open-source engine that computed every figure in this post from the Northwind inputs shown.
https://skills.aajconsult.com →
AAJ — Incrementality Testing for Startups
How to run a geo or audience holdout to establish whether marketing caused revenue, rather than touched it.
https://aajconsult.com/blog/incrementality-testing-for-startups →
AAJ — Our pipeline is full and nothing is closing. What's actually wrong?
Companion post on stage progression and weighted forecasting — the layer beneath the funnel rates quoted here.
https://aajconsult.com/blog/pipeline-full-nothing-closing →
AAJ — My LTV:CAC is bad. Which number do you actually fix?
Companion post applying the same reproducible engine-output method to unit economics and CAC payback.
https://aajconsult.com/blog/ltv-cac-which-number-to-fix →
More in Analytics, Experiments & Budget
Part of the Analytics, Experiments & Budget hub - see all 22 resources on this topic.