Your NRR is 100% and you are losing a quarter of your customers
By Saroj Jha · August 9, 2026 · 9 min read
Net revenue retention is the number your board asks for first. It is also the number most likely to be hiding something, because it nets two forces against each other and reports only the difference.

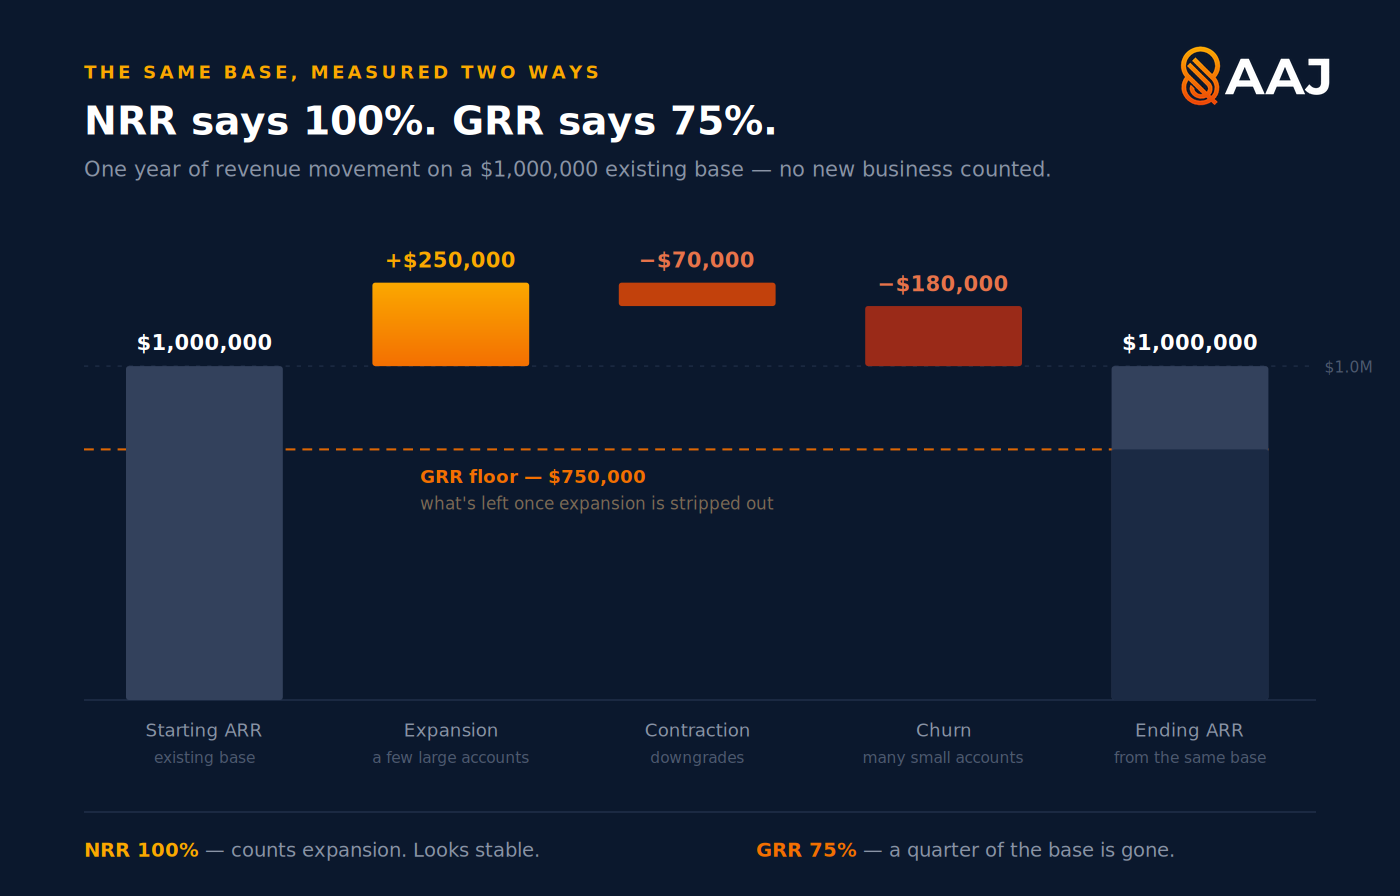
The netted number
100% / 75%
NRR against gross revenue retention
NRR 100%. A quarter of the base gone.
It can sit at exactly 100% — the threshold everyone treats as healthy — while a quarter of your revenue base walks out the door.
Here is how, with the arithmetic shown.
The worked example
A company starts the year with $1,000,000 in ARR from existing customers. Over twelve months, from that same base — no new business counted:
- Expansion: +$250,000
- Contraction: −$70,000
- Churn: −$180,000
Net revenue retention counts all three:
NRR = (1,000,000 + 250,000 − 70,000 − 180,000) / 1,000,000 = 100%
A clean 100%. Nothing to report.
Gross revenue retention counts only what you lost:
GRR = (1,000,000 − 70,000 − 180,000) / 1,000,000 = 75%
Twenty-five percent of the base gone. The expansion revenue — most of it probably from a handful of your largest accounts — covers the hole exactly. From the outside, and from the board deck, the base looks stable. It is not stable. It is two large forces cancelling, and only one of them is under your control.
What good actually looks like
Before diagnosing your own numbers, know which peer group you belong to, because the single median is close to meaningless.
SaaS Capital's 2026 survey of more than 1,000 private B2B SaaS companies puts bootstrapped businesses between $3M and $20M ARR at a median NRR of 103% and GRR of 91% — both essentially flat year on year, while median revenue growth for those bootstrapped companies fell to 15% from 20%. Retention held; growth did not. When new business slows, the existing base does more of the work, which is precisely why the gap between those two numbers has become the interesting part.
Note the qualifier: those are bootstrapped medians. A venture-backed company at the same ARR is running a different playbook, usually with a different customer mix, and should not benchmark against them.
Segment by contract value and the single median falls apart entirely. In our work, enterprise-focused products — six-figure contracts, multi-year terms, seat and usage expansion built in — retain and expand materially better than SMB-focused products sold month to month, where churn is structural rather than fixable. An SMB-focused company sitting just under 100% NRR may be exactly at its peer median; the same number at an enterprise-focused company is a serious problem. Benchmark against a peer group with your contract value and pricing model, never against a blended median.
On the gross side, a GRR consistently below 90% is the signal that matters — it points at structural product-fit or pricing issues that no amount of expansion can mask.
Why the difference matters more than either number
Expansion and retention have different failure modes. Expansion concentrates. It usually comes from a small number of accounts growing seats or usage. Churn distributes — many small accounts leaving quietly. A 100% NRR built from heavy churn plus heavy expansion means your revenue depends on a handful of relationships. Lose one, and the number that looked fine last quarter collapses.
Churn compounds against you; expansion does not compound for you. Customers who left cannot expand next year. Every point of gross churn permanently removes future expansion capacity. A base leaking 25% annually needs its expansion to grow faster every year just to hold the same NRR — which is a treadmill, not a flywheel.
Lifetime value is roughly inversely proportional to churn. At 25% annual gross revenue churn, the average relationship lasts about four years — that is simply 1 ÷ 0.25, arithmetic rather than a benchmark. Halve churn to 12.5% and it lasts eight — the lifetime value of every customer you acquire roughly doubles, without changing acquisition spend at all. For a Seed–Series B company, that is usually the largest single lever available. None of it is visible in an NRR of 100%.
And it moves your valuation. Companies with strong net revenue retention command higher ARR multiples than companies stuck at flat retention. Retention has stopped being an operational metric and become a primary valuation input — which is exactly why reporting the netted number without the gross one is a problem for you, not just for your board.
The four numbers to read together
NRR tells you whether the base is growing. GRR tells you whether it is leaking. Read them side by side, always. NRR alone is a summary statistic that discards the thing you most need to act on.
Quick ratio tells you whether growth is efficient. Everything gained — new business plus expansion — over everything lost. Adding $300,000 in new business to the example above:
Quick ratio = (300,000 + 250,000) / (70,000 + 180,000) = 2.2
You are adding $2.20 for every $1.00 leaving. Workable, and a long way from the 4× that signals a genuinely efficient engine. The whole gap is on the losing side.
Logo churn against revenue churn. If revenue churn is low but logo churn is high, you are losing small customers and keeping large ones. That looks fine this year and is dangerous over three, because today's small customers are the source of tomorrow's large ones.
Where the leak actually is
The cohort view answers this and the summary numbers never will. Plot revenue retained by signup cohort against months since signup. The shape names the problem.
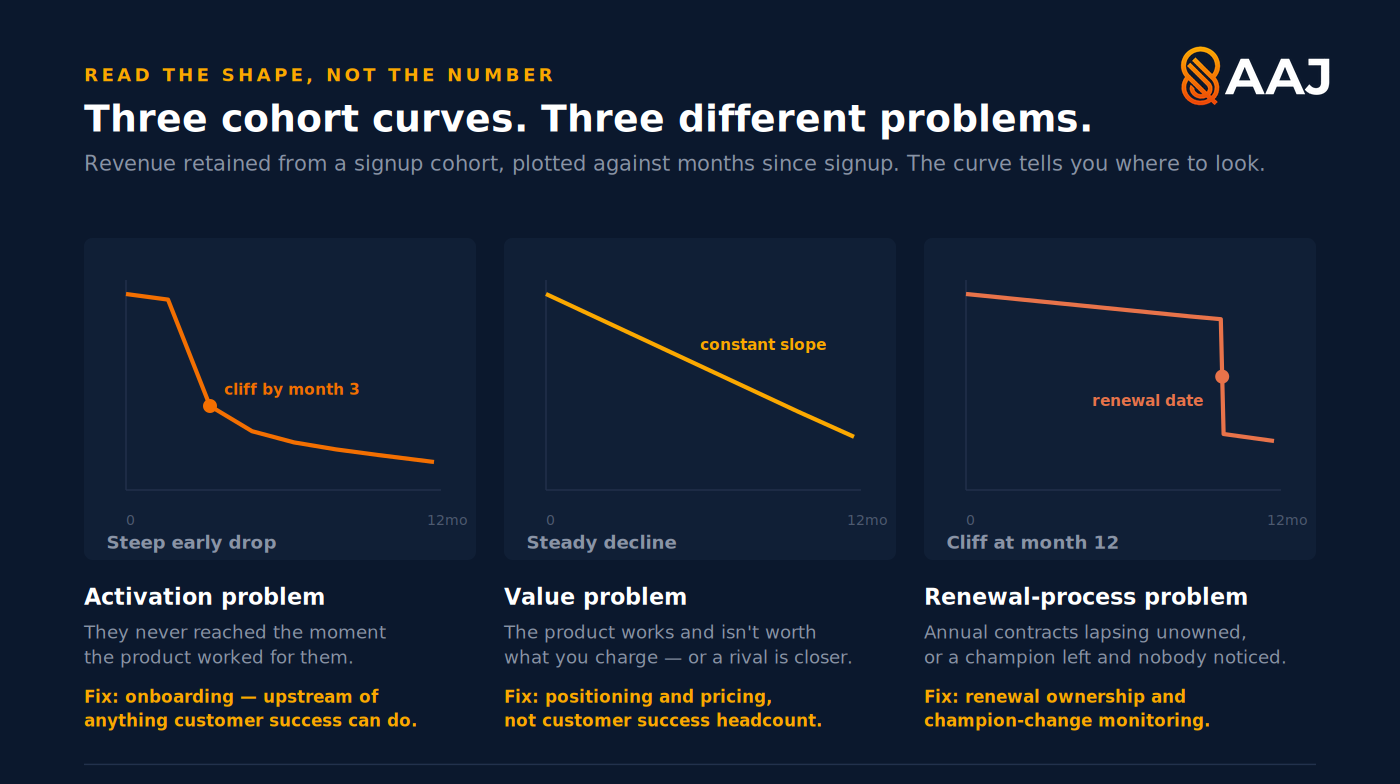
A steep drop in the first 60–90 days is an activation problem, not a retention problem. Those customers never reached the moment where the product worked for them. The fix lives in onboarding, upstream of anything a customer success team can do. Hiring CSMs to solve this is the most common and most expensive misdiagnosis in the category.
A steady decline throughout is a value problem. The product works and it is not worth what you charge, or a competitor has moved closer. That is positioning and pricing, and no amount of proactive outreach will fix it.
A cliff at twelve months is a renewal-process problem. Annual contracts lapsing without anyone owning the conversation, or a champion leaving and nobody noticing. This one is operational and usually the fastest to fix.
Each has a different remedy and they are not interchangeable. Companies that treat every retention problem as a customer-success staffing problem are usually solving the wrong one at the highest available cost.
Fix them in this order
Involuntary churn first. Failed payments, expired cards, dunning that gives up after two attempts. In our work this is consistently a meaningful slice of total churn, and most of it is recoverable through dunning and card-update automation. It has nothing to do with whether customers like your product, and fixing it is about a week of work. This is the cheapest retention win available and most companies have never measured it separately.
Then activation. If the cohort curve drops early, everything downstream is wasted effort. Define the moment a customer first gets real value, measure what fraction reach it, and work on that fraction.
Then the largest voluntary reason. Ask the customers who left. Not a survey — a conversation. At Seed–Series B volume you can speak to every one of them, and twenty conversations will tell you more than any dashboard.
Then expansion. Last, deliberately. Expansion built on a leaking base is where the 100%-NRR illusion comes from in the first place.
One useful sanity check on where your churn is likely concentrated: low-ARPU accounts churn at a far higher monthly rate than four-figure-ARPU accounts. If you serve both, your blended number is telling you about neither — split it.
Run your own
npx skills add sarojkjha/aaj-marketing-skills --skill lifecycle-and-retention --yes
Give it one period of revenue movement on your existing base — starting revenue, expansion, contraction, churn — and it returns NRR, GRR, logo churn and the quick ratio, each flagged against benchmark, plus what halving churn would do to your LTV.
One methodological note that matters more than it sounds: leave new business out of the retention calculation. Including new sales inflates the quick ratio and hides the churn you are trying to see. Measure the existing base against itself, and pick monthly or annual consistently so the benchmarks you compare against are the right ones.
The short version
If your board deck shows one retention number, it is showing you the one that nets your biggest problem against your biggest strength and reports the difference.
Show both. A 100% NRR built on 91% GRR is a healthy business. A 100% NRR built on 75% GRR is a leaking one being propped up by a handful of accounts. They look identical on the slide, and they are not the same company.
References
- SaaS Capital, Benchmarking Metrics for Bootstrapped SaaS Companies (published 24 April 2026) — annual survey of 1,000+ private B2B SaaS companies. Median NRR 103%, GRR 91% and revenue growth 15% for bootstrapped companies between $3M and $20M ARR. https://www.saas-capital.com/blog-posts/benchmarking-metrics-for-bootstrapped-saas-companies/
- Worked example, cohort shapes and the segment observations in this post are AAJ Consult's, from client work. Where a segment benchmark could not be traced to the organisation that ran the study, the number has been removed rather than restated.
Benchmarks are directional. Definitions vary between sources — some report net dollar retention, some net ARR expansion, some a renewal rate that is not NRR at all. Compare your numbers against a peer group with your ACV and your pricing model, not against a blended median.
lifecycle-and-retention is one of 39 free, MIT-licensed marketing skills for AI agents at skills.aajconsult.com. 24 of them run real engines. If you'd rather work in a spreadsheet, the Retention & NRR Workbook does the same arithmetic with the cohort view and LTV sizer built in.
More in Retention, Expansion & Advocacy
Part of the Retention, Expansion & Advocacy hub - see all 6 resources on this topic.
- Free tool: Churn & Retention Calculator
- Template: The Retention & NRR Workbook
- Playbook: Customer Onboarding & Retention Playbook
- AI agent skill: Lifecycle & Retention
Also useful in Analytics, Experiments & Budget.