Get the Retention & NRR Workbook
- Home
- Resource Hub
- Retention, Expansion & Advocacy
- Retention & NRR Workbook
Keep and grow the customers you already have — the highest-leverage growth there is. One Excel workbook (opens in Google Sheets) that turns a period of revenue movement into the retention numbers that decide whether the business compounds: NRR, GRR, revenue and logo churn, the quick ratio, lifetime and LTV — each with what it means in plain English. It finds where the base leaks with a cohort view and a churn breakdown, then turns it into a prioritized plan and sizes the LTV prize. Built on the method AAJ uses with Seed–Series B teams.
Free. No spam — just the workbook (and the occasional growth playbook). Unsubscribe anytime.
Six things it does out of the box
Enter one period of revenue movement in the blue cells, and the workbook computes NRR, GRR, churn, quick ratio, cohort curves, the churn breakdown, the plain-English reads and the LTV sizer automatically.
-
The retention metrics, computed for you
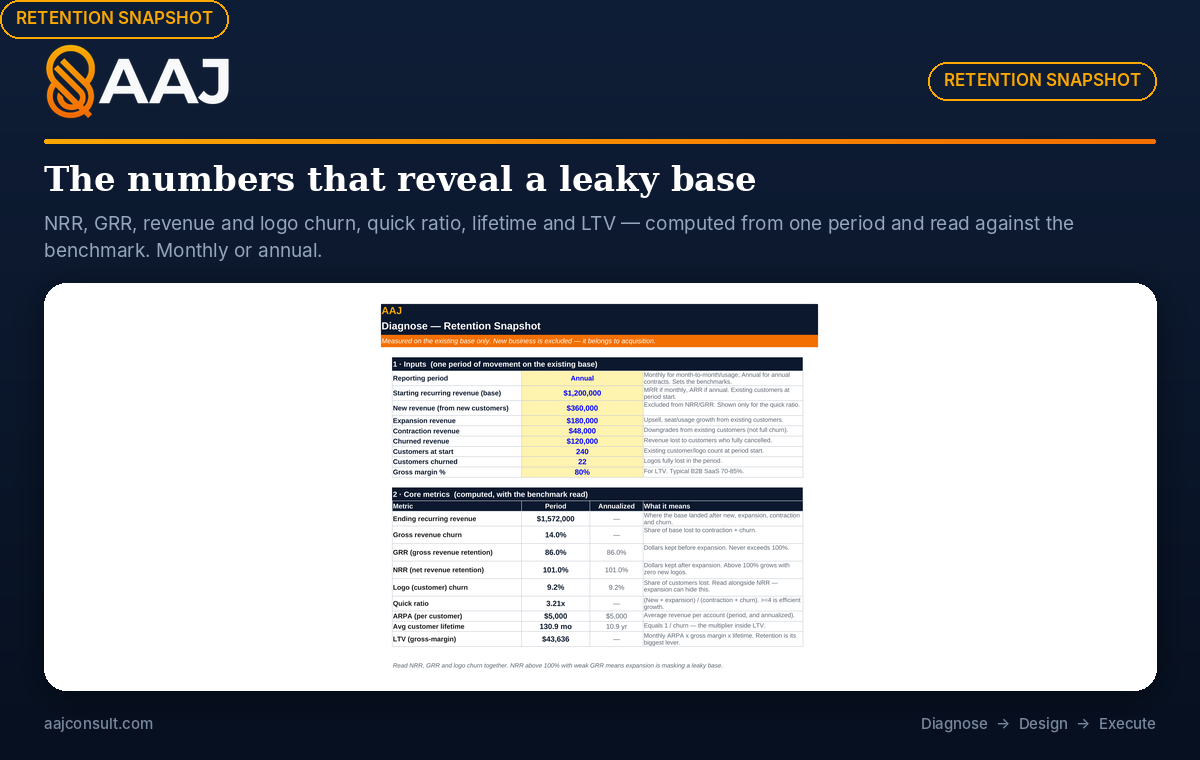
Enter one period of movement (starting revenue, new, expansion, contraction, churned) and customer counts, and it computes NRR, GRR, revenue and logo churn, the quick ratio, ARPA, average lifetime and LTV.
-
NRR and GRR, side by side
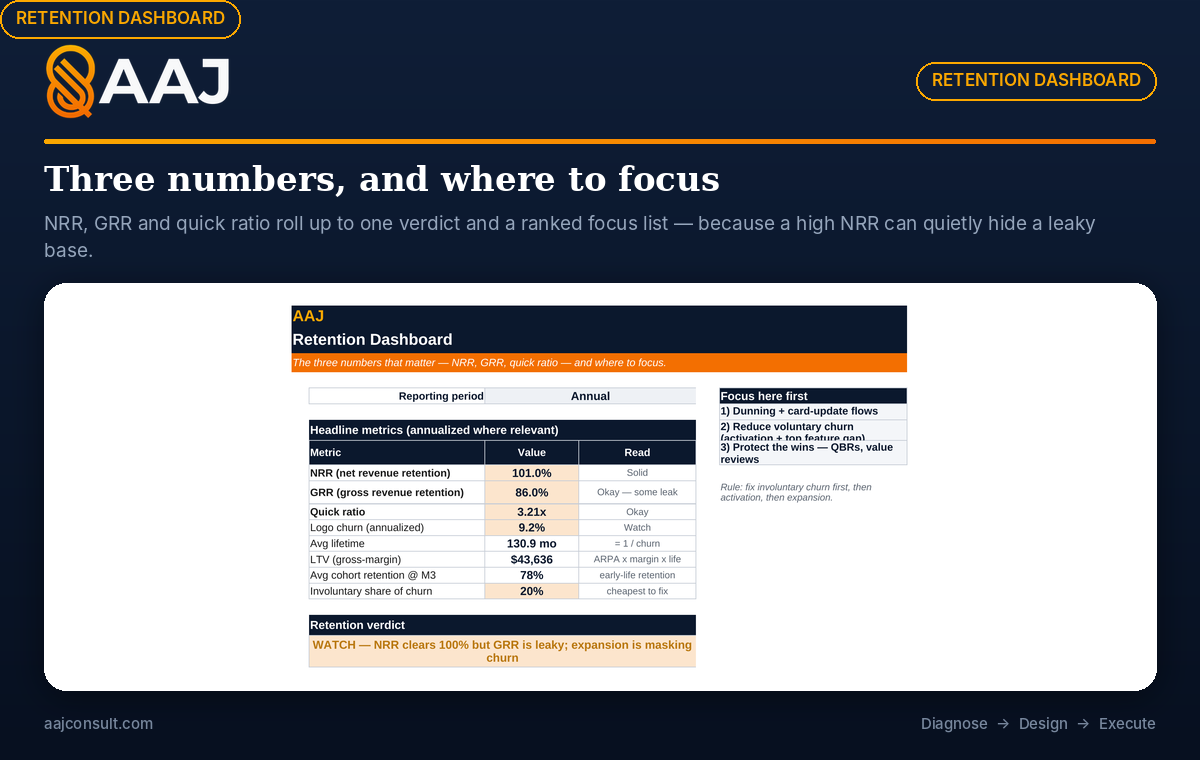
Net and gross retention together, because a healthy-looking NRR can hide a leaky base. The workbook shows both, plus logo churn, so expansion can't quietly paper over churn.
-
Plain-English reads
Every headline number comes with what it means in plain English, and GRR is shown next to one sourced reference point: SaaS Capital's 2026 median for bootstrapped B2B SaaS. The verdict rules are the workbook's own, and it says so.
-
A cohort retention view
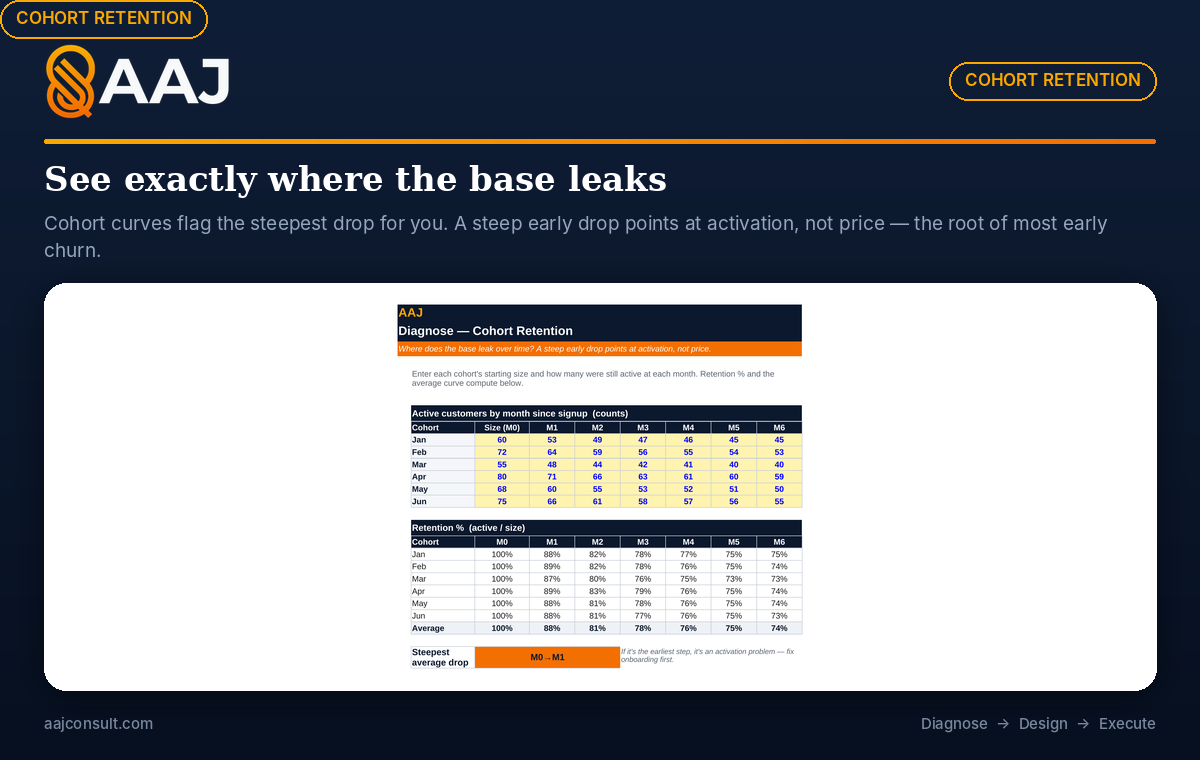
See how each signup cohort retains over time, with the steepest average drop flagged automatically — a steep early drop points at activation, not price.
-
A churn breakdown that ranks the fix
Split churn voluntary vs involuntary by reason. Involuntary churn (failed payments) is usually the biggest, cheapest win — the workbook surfaces its share first.
-
A plan that sizes the prize
Prioritize retention levers by impact vs effort, and see exactly what cutting churn does to LTV — because lifetime value is proportional to 1 / churn.
Diagnose → Design → Execute
1Diagnose
Enter one period of revenue movement and customer counts on your existing base. Pick monthly or annual, and monthly figures are annualized so they compare like for like.
2Design
NRR, GRR, churn, the quick ratio, the cohort curves and the churn breakdown all compute automatically.
3Execute
Read the verdict, prioritize the levers by impact and effort, size the LTV upside, and assign owners.
Founders and growth or marketing leaders watching new sales run just to stand still
For founders and growth or marketing leaders watching new sales run just to stand still — where every new customer seems to be replacing one that left. If you can't quite answer "is our base compounding or leaking?", or you've celebrated a healthy NRR without noticing the logos bleeding underneath it, this gives you NRR, GRR, churn and the quick ratio with what each one means, shows where the base leaks by cohort, and turns it into a prioritized retention plan. Pairs with the Marketing KPI Board Report (where NRR shows up in front of the board) and the Marketing Budget Planner (the LTV retention drives is what sets your CAC ceiling).
Frequently Asked Questions
Common questions about the Retention & NRR Workbook.
What's a good NRR and GRR for a startup?
Above 100% NRR, the base grows with no new customers; below 100%, new sales run just to stand still. For a reference point, SaaS Capital's 2026 survey puts median NRR at 103% and median GRR at 91% for bootstrapped B2B SaaS companies between $3M and $20M ARR. Venture-backed, enterprise and SMB companies differ, so compare with your own segment, and watch the trend as much as the level.
What's the difference between NRR and GRR?
GRR (gross revenue retention) measures the dollars you keep before any expansion — it can never exceed 100%. NRR (net revenue retention) counts expansion too, so it can exceed 100%. The gap between them is your expansion. The trap: a strong NRR can hide a weak GRR when a few big expansions mask heavy churn — which is why the workbook always shows both, plus logo churn.
Does it work in Google Sheets?
Yes. It's an Excel workbook (.xlsx) that opens in Google Sheets via File → Import — the NRR/GRR/churn math, the cohort retention view, the churn breakdown, the plain-English reads and the LTV sizer all work.
Should I focus on retention or acquisition?
If the base leaks, retention first. Pouring traffic into a leaky funnel just raises CAC — you're renting growth instead of compounding it. Because LTV is proportional to 1/churn, halving churn roughly doubles lifetime value. Fix involuntary churn and activation first, then build the expansion motion that pushes NRR past 100%.
Find where your base leaks — before you spend more on acquisition
Reporting NRR to your board? Get the Marketing KPI Board Report →
Sources
- SaaS Capital , Benchmarking Metrics for Bootstrapped SaaS Companies (1,000+ private B2B SaaS companies; figures cited are for bootstrapped companies between $3M and $20M ARR, 2026) — Median net revenue retention for bootstrapped private B2B SaaS companies between $3M and $20M ARR is 103%.
- SaaS Capital , Benchmarking Metrics for Bootstrapped SaaS Companies (1,000+ private B2B SaaS companies; figures cited are for bootstrapped companies between $3M and $20M ARR, 2026) — Median gross revenue retention for bootstrapped private B2B SaaS companies between $3M and $20M ARR is 91%.
- Bessemer Venture Partners , Scaling to $100 Million (Investor guidance for cloud companies, drawing on Bessemer data; not a survey, Not a survey) — Cloud companies should aim for 65-70% gross margins over time; the middle 50% of cloud businesses sit within roughly 60-80%.
Last verified 26 Sept 2026 · next review 16 Mar 2027 · 3 figures maintained in the Benchmark Library
What this resource helps you do
Turn a period of revenue movement into NRR, GRR, churn and quick ratio — each with a plain-English read — plus a cohort view, a churn breakdown, and an LTV sizer.
Get the workbook from AAJ's free marketing templates library.
More in Retention, Expansion & Advocacy
Part of the Retention, Expansion & Advocacy hub - see all 13 resources on this topic.
- Free tool: Churn & Retention Calculator
- Free tool: Cohort Retention Curve Builder
- Template: The Lifecycle Email Audit
- Article: Your NRR is 100% and you are losing a quarter of your customers
Also useful in Analytics, Experiments & Budget.