Get the Sales Pipeline & Forecast Tracker
- Home
- Resource Hub
- Sales & Pipeline
- Sales Pipeline & Forecast Tracker
Will you actually hit the number? One Excel workbook (opens in Google Sheets) that weights your pipeline by real stage probabilities, checks coverage against what YOUR win rate requires, computes the gap — and names the lever to pull. Built on the method AAJ uses with Seed–Series B teams.
Free. No spam — just the tracker (and the occasional growth playbook). Unsubscribe anytime.
Six things it does out of the box
Pre-filled with a worked example. Replace the blue cells with your own numbers and the whole workbook — deals, forecast, coverage, dashboard — recalculates itself.
-
Coverage math from YOUR win rate
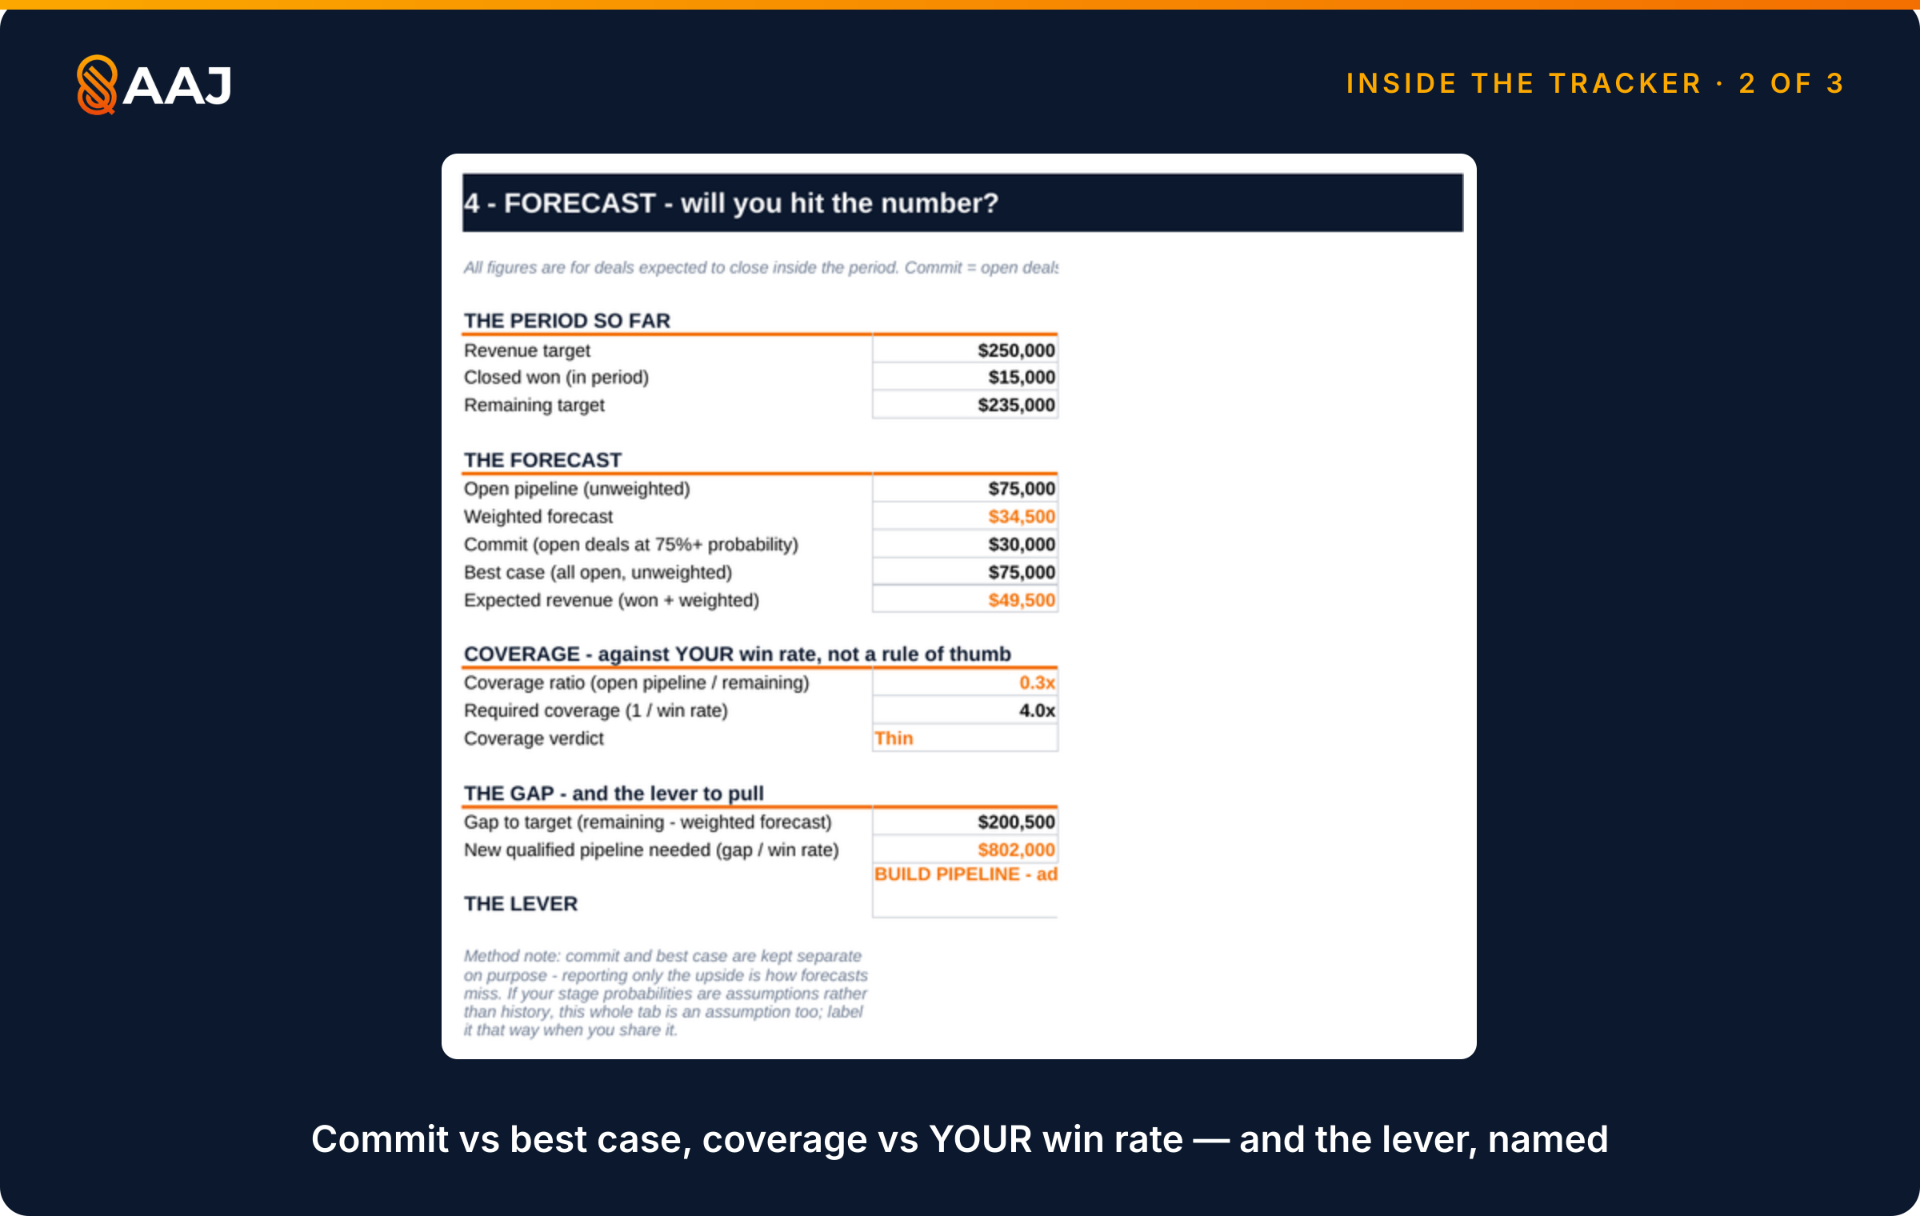
The "3x pipeline rule" is only right if you win a third of your deals. Enter your real win rate; the tracker computes the coverage you actually need (25% win rate → 4x).
-
A deal tracker that weights itself
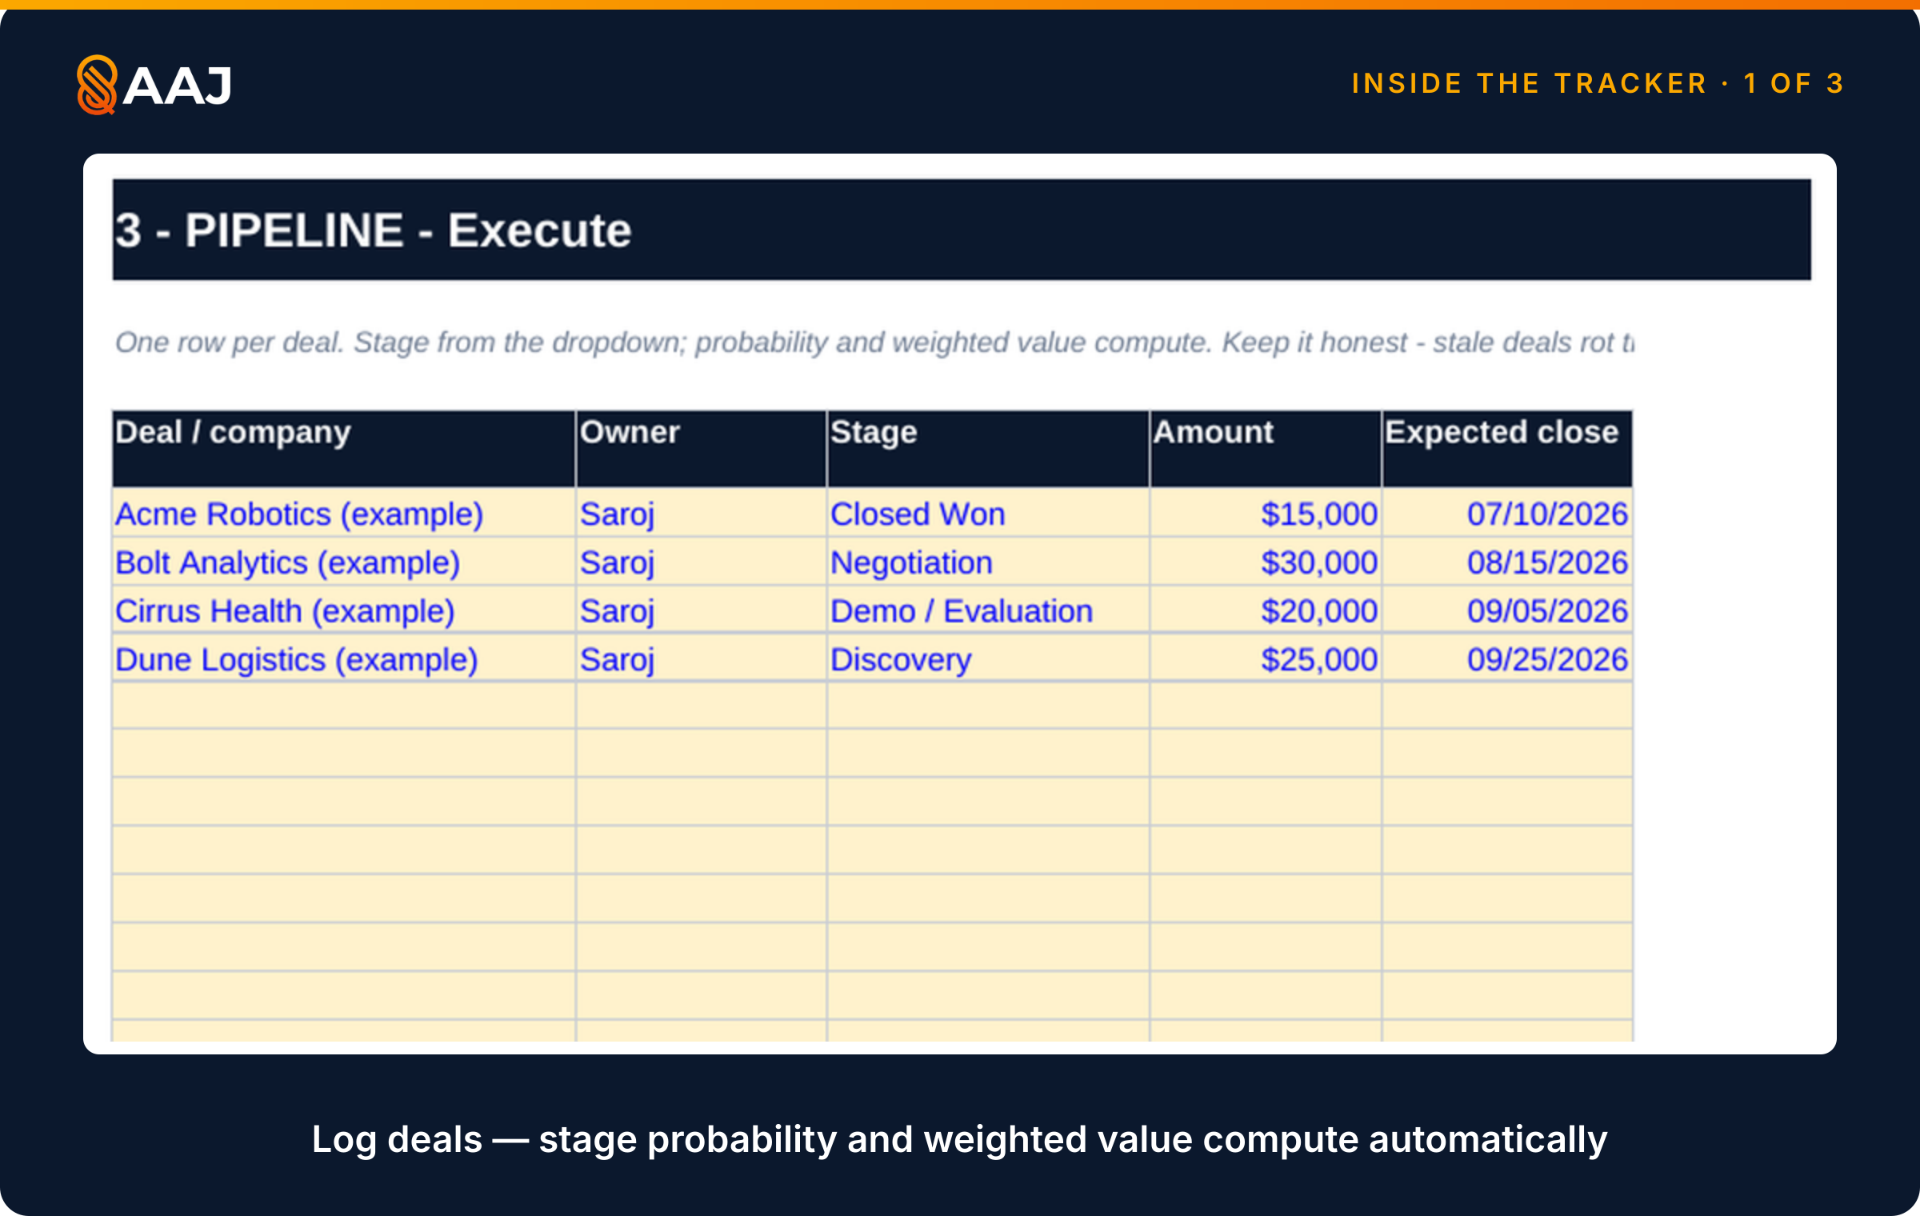
One row per deal: pick the stage, and probability and weighted value compute automatically from your stage table. A date filter handles what counts this period.
-
Commit vs best case, kept separate
Commit is auto-computed as open deals at 75%+ probability. Reporting only the upside is how forecasts miss — this tracker won't let you.
-
The gap, in dollars
Remaining target minus weighted forecast, then the new qualified pipeline needed at your win rate. Not a feeling. A number.
-
THE LEVER, named
A formula that tells you in plain words what to do: build pipeline (with the exact amount), push conversion on deals you have, or hold and protect the commit.
-
Stage analysis + board-ready dashboard
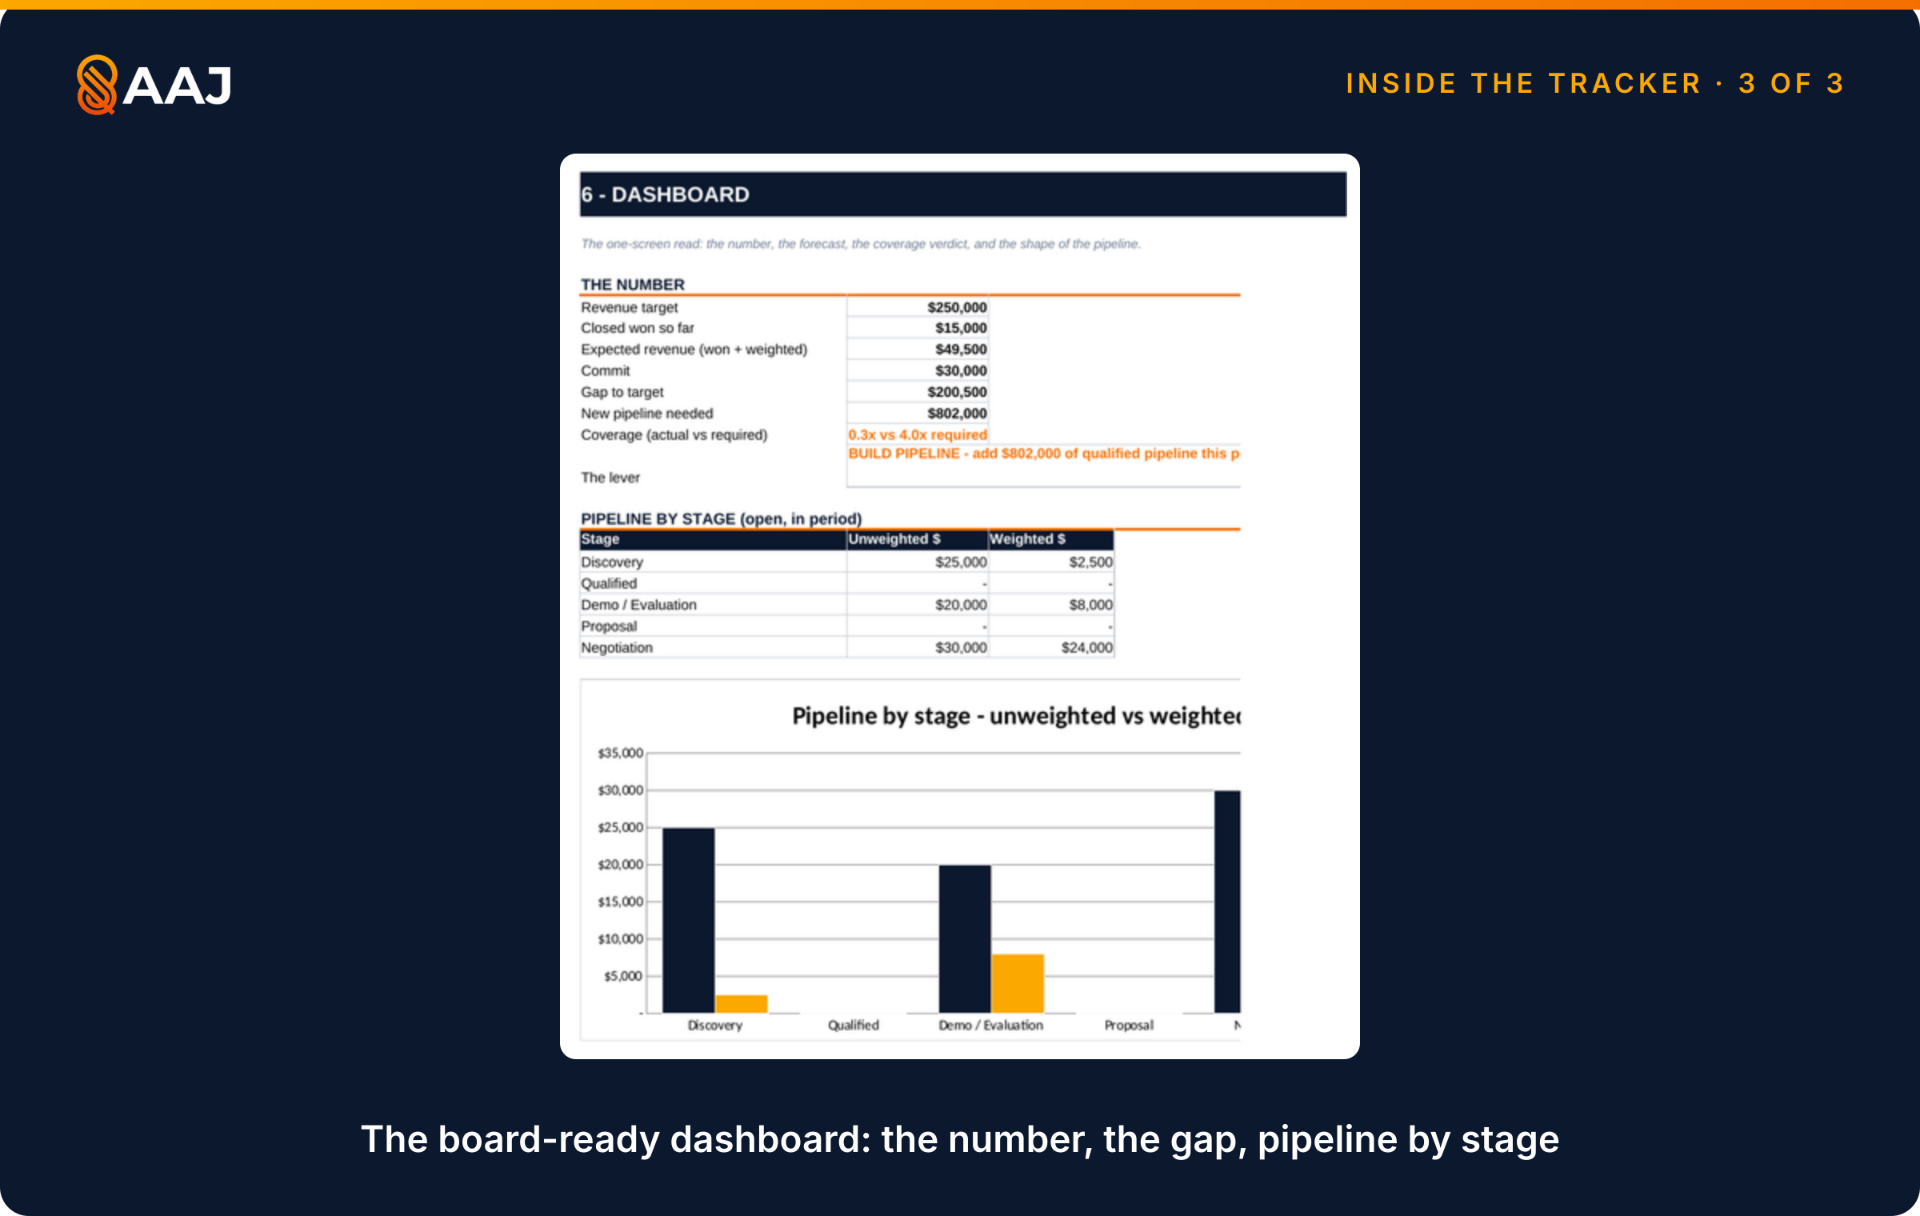
Spot a hollow mid-funnel a month before it becomes a miss, and report the quarter on one screen.
Diagnose → Design → Execute
1Diagnose
Enter the period, target and your historical win rate. The tracker computes the deals and pipeline you actually need.
2Design
Set your stages and their close probabilities — from conversion history, not optimism. Every number downstream depends on these.
3Execute
Log deals weekly. Read the forecast, the coverage verdict, and the lever — then do what it says.
Founder-sellers and first sales hires owning a real number
For founder-sellers and first sales hires who own a revenue number without a RevOps team behind them. If your forecast is a gut feeling, if "we have plenty of pipeline" has ever ended in a missed quarter, or if the board asks "will you hit the number?" and the honest answer is a shrug — this tracker replaces the shrug with math. Pairs with the Marketing Budget Planner: one plans the spend that creates pipeline, the other tells you if it's enough.
Frequently Asked Questions
Common questions about the Sales Pipeline & Forecast Tracker.
What is a good pipeline coverage ratio?
The classic rule of thumb is 3x — three dollars of qualified pipeline for every dollar of target. It is only right if you win about one qualified deal in three. The honest formula is 1 ÷ your win rate: a 25% win rate needs 4x coverage, a 20% win rate needs 5x. The tracker computes yours from your own numbers.
What's the difference between weighted and unweighted pipeline?
Unweighted pipeline sums every open deal at face value — useful for judging whether you're generating enough volume. Weighted pipeline multiplies each deal by its stage's close probability — a $100K deal at a 30% stage counts as $30K — which is the more honest forecast. The tracker computes both and uses each where it belongs.
Does it work in Google Sheets?
Yes. It's an Excel workbook (.xlsx) that opens in Google Sheets via File → Import — the probability lookups, coverage math and the lever all work.
What counts as qualified pipeline?
Deals with documented need, identified stakeholders, a realistic timeline and a dated expected close — not every open CRM record. The tracker enforces one piece of this mechanically: a deal without an expected close date counts toward no period at all.
Replace the shrug with math
One email. The full tracker in your inbox.
Planning the spend side too? Get the Marketing Budget Planner →
What this resource helps you do
Will you hit the number? A weighted forecast, coverage math from your real win rate, the gap in dollars — and the lever to pull, named in plain words.
Get the tracker from AAJ's free marketing templates library.
More in Sales & Pipeline
Part of the Sales & Pipeline hub - see all 38 resources on this topic.
- Playbook: Account-Based Marketing (ABM) Playbook
- Article: Battlecards for a Three-Rep Team
- Article: Cold Email for Founders: How to Write a Sequence That Gets Replies
- AI agent skill: Cold Email Sequence
Also useful in Analytics, Experiments & Budget.