Get the Marketing Budget Planner
- Home
- Resource Hub
- Analytics, Experiments & Budget
- Marketing Budget Planner
Size, allocate, track and forecast your marketing spend — in one Excel workbook (opens in Google Sheets too). Formula-driven, sourced wherever it cites a number, and built on the same Diagnose → Design → Execute method AAJ uses with Seed–Series B teams.
Free. No spam — just the planner (and the occasional growth playbook). Unsubscribe anytime.

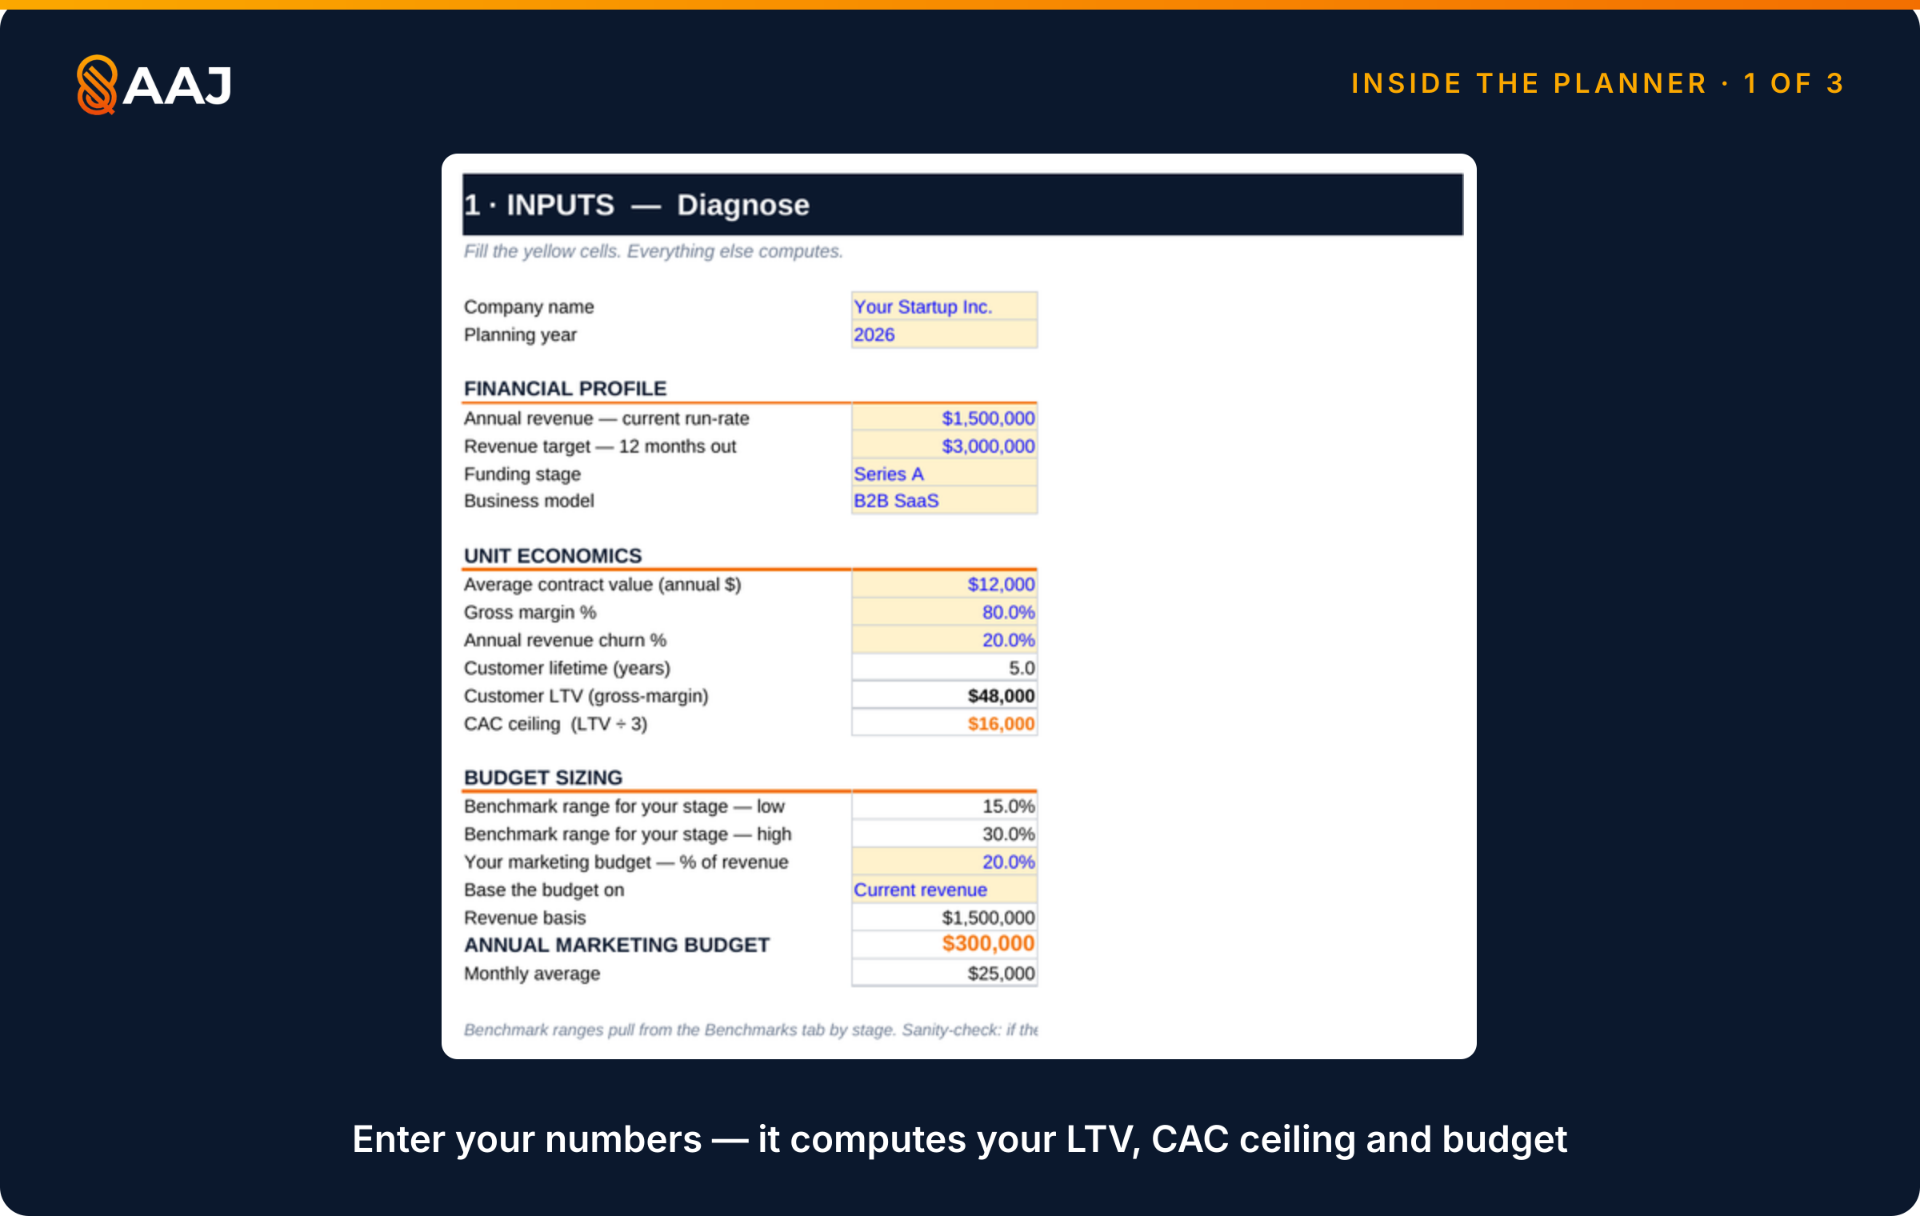
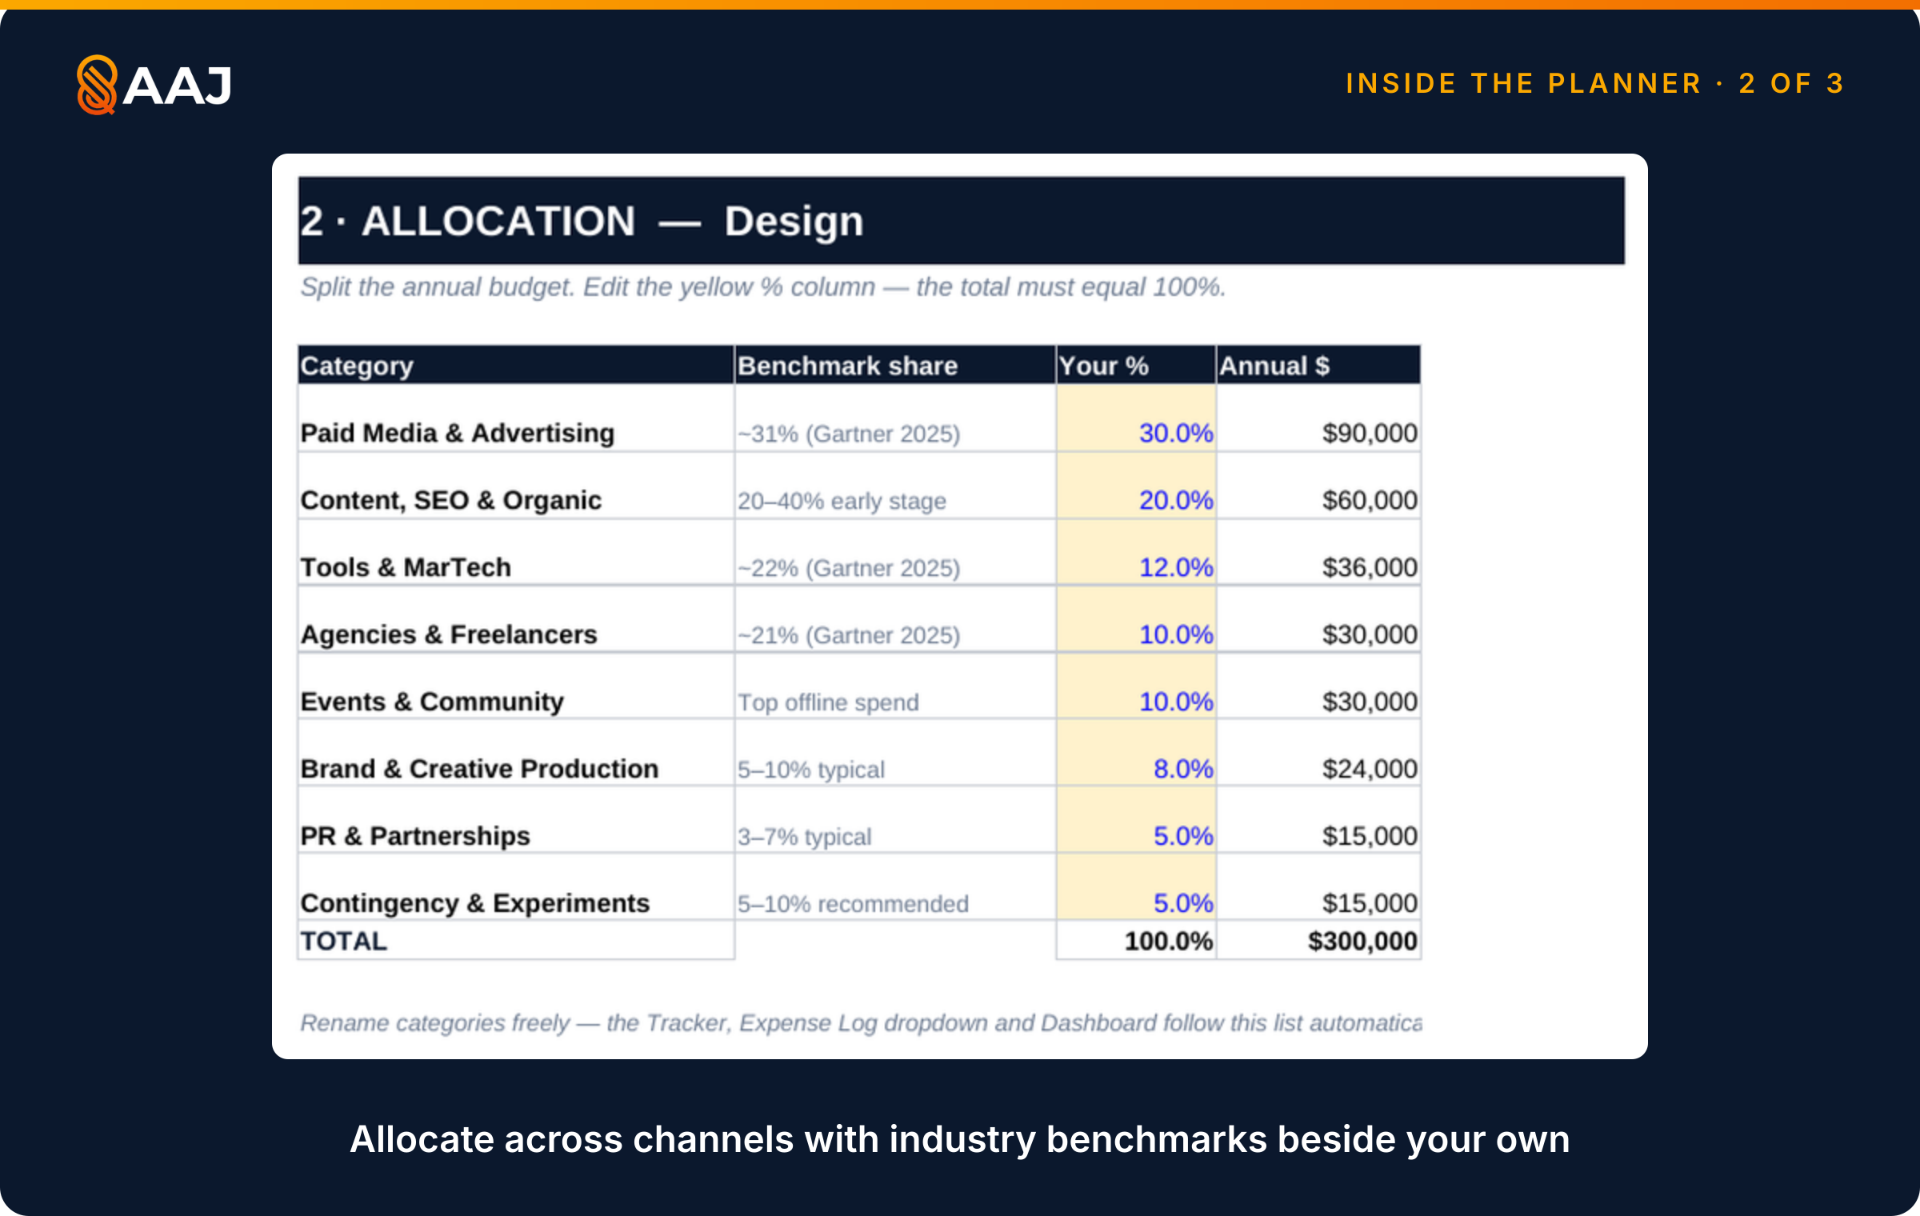
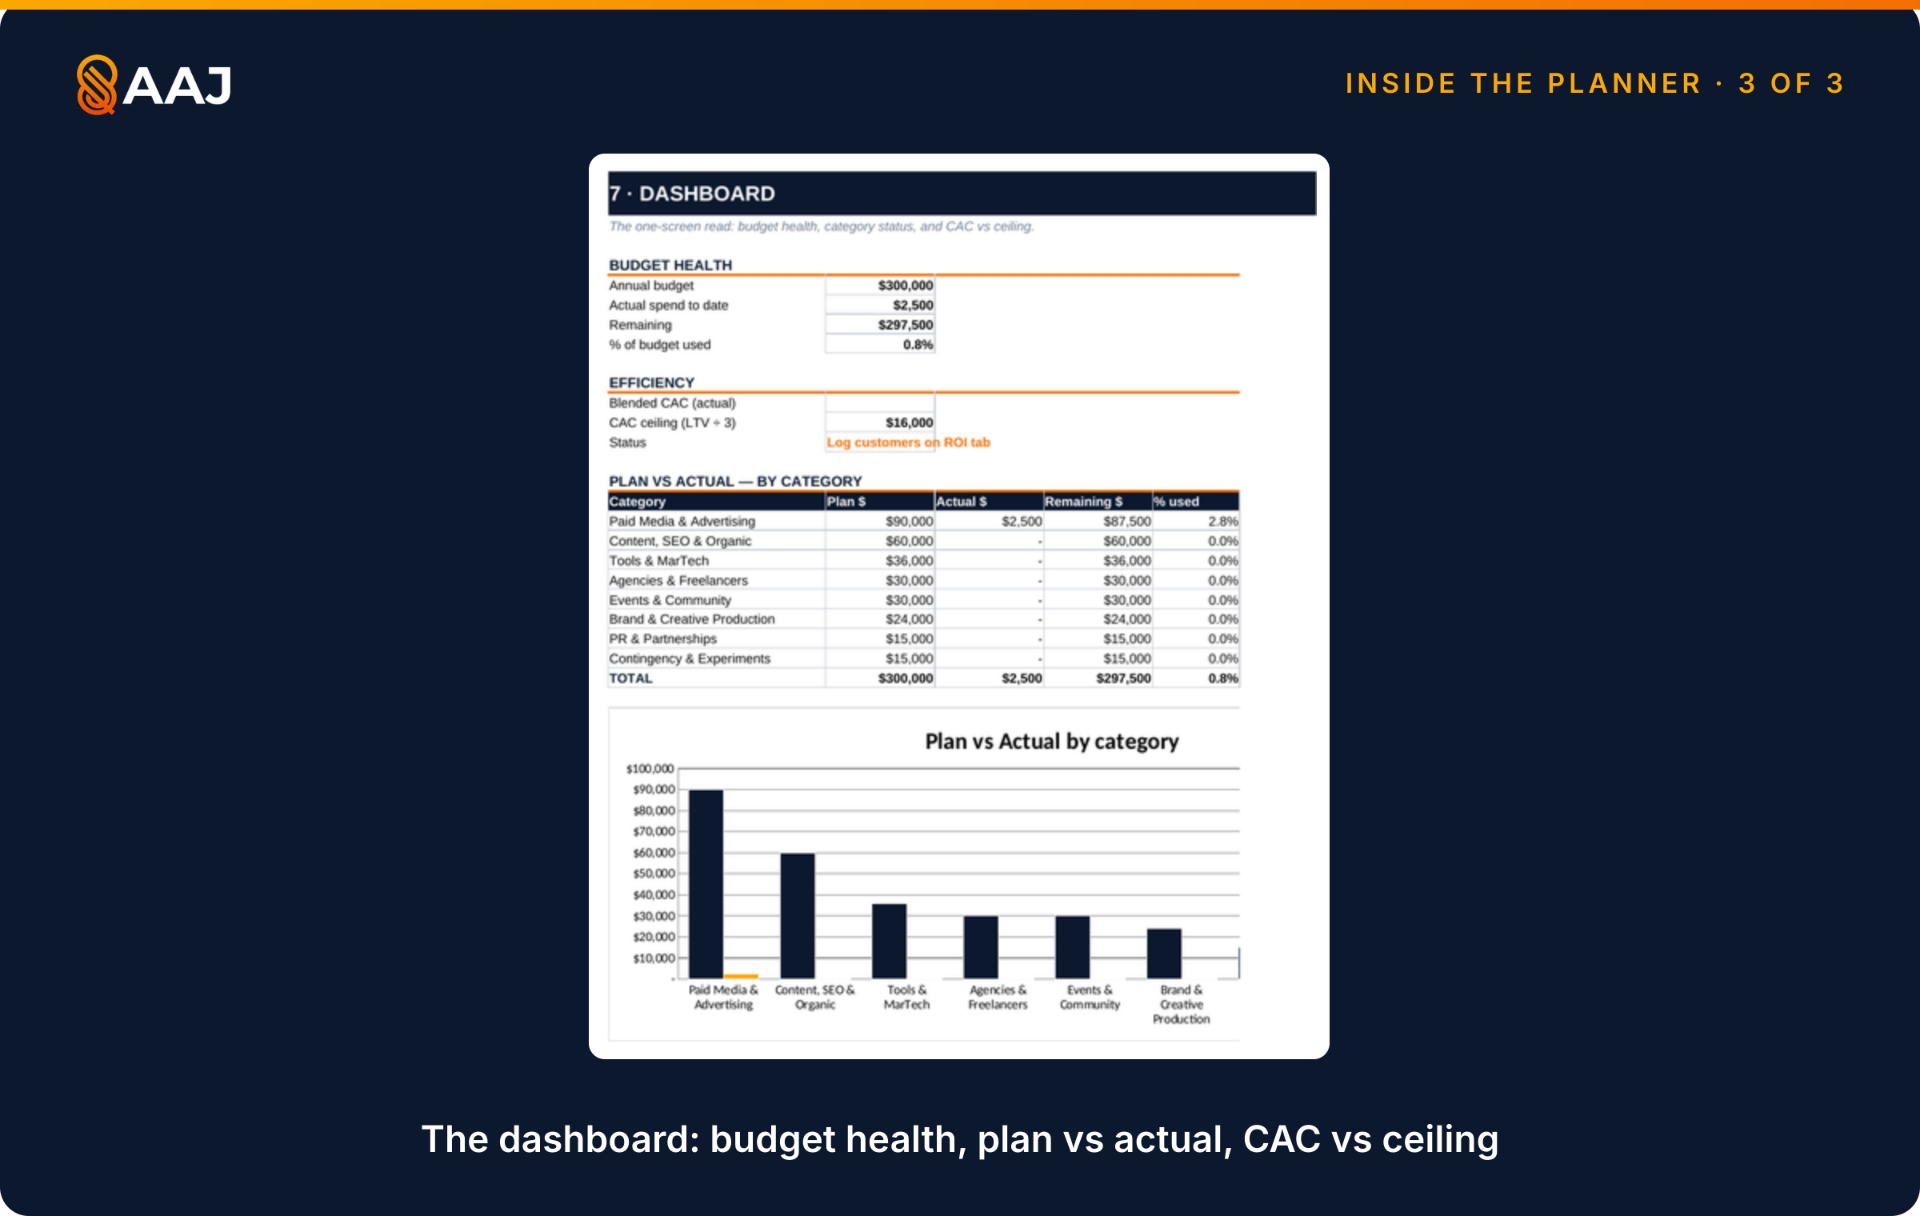
Six things it does out of the box
Pre-filled with a worked example. Replace the blue cells with your own numbers and the whole workbook — allocation, tracker, verdicts, forecast — recalculates itself.
-
Stage-banded budget sizing
Enter your revenue and funding stage; get a budget range from AAJ's stage bands, checked against Gartner and SaaS Capital reference points.
-
Unit-economics guardrails
The planner computes your LTV and a CAC ceiling (LTV ÷ 3), so every allocation decision answers to what a customer is worth.
-
Channel allocation with sourced reference shares
Split spend across eight categories, with Gartner's paid-media and martech shares beside your own where a sourced figure exists. Totals check themselves.
-
Plan-vs-actual tracker with an automatic expense log
Log expenses once; monthly actuals, variances and the dashboard update themselves. No copy-paste bookkeeping.
-
Per-channel ROI verdicts
CPL, CAC, ROAS and LTV:CAC per channel, each judged against your ceiling: scale it, or fix it.
-
A forecast that talks back
See the new customers and new ARR your planned spend should buy, quarter by quarter.
Diagnose → Design → Execute
1Diagnose
Enter revenue, stage, and unit economics. The planner sizes your budget against AAJ's stage bands and computes your CAC ceiling.
2Design
Allocate across channels with sourced reference shares where they exist. The workbook flags when allocations don't add up.
3Execute
Track spend monthly, judge every channel against your ceiling, and re-forecast the year each quarter.
Founders and early marketing hires owning a real budget
Built for Seed–Series B founders and early marketing hires who own a real budget for the first time — say $100K–$2M a year — and want a defensible answer to "how much should we spend, and on what?" If you've already downloaded the Startup Marketing Plan, this is the money layer that funds it.
Frequently Asked Questions
Common questions about the Marketing Budget Planner.
How much should a startup spend on marketing?
It depends on stage, and the base changes with it. AAJ's working bands are 20–30% of ARR at Series A, 12–20% of revenue at Series B, 15–25% while scaling and 5–7% once mature; before revenue, size the budget against burn or funding raised instead. For reference, SaaS Capital's 2026 survey puts the median private B2B SaaS company at 8% of ARR, and Gartner's all-industry average is 7.8% of revenue.
Does it work in Google Sheets?
Yes. It's built as an Excel workbook (.xlsx) and opens in Google Sheets via File → Import. All formulas are compatible.
Does it include salaries?
By default it covers program spend — media, content, tools, agencies, events. Categories are fully renameable, so you can add a Labor line if you budget fully-loaded.
What data is the guidance based on?
The Benchmarks tab names the source for every reference point: Gartner's CMO Spend Survey, SaaS Capital's private-SaaS spending benchmarks, David Skok and Bessemer. The stage bands are AAJ's own working estimates and are marked as ours.
Plan the year in an afternoon.
One email. The full planner in your inbox.
Prefer a quick check first? Try the free Marketing Budget Calculator →
Sources
- AAJ working range (a stated planning view, not survey or client data) (AAJ's stated planning view for B2B SaaS, Pre-Seed to Enterprise; not survey or client data, 2026) — AAJ's working range for Series A companies: 20–30% of ARR spent on marketing. Built from: AAJ's stated planning view, set against the published anchors in the Marketing Budget Benchmarks 2026 report (Gartner's 2026 CMO Spend Survey, The CMO Survey 2026 and SaaS Capital's 2026 spending benchmarks); expressed of ARR. Illustrative arithmetic from this band, not observed data: Illustrative: $3M ARR × 20–30% = $600K–$900K a year
- AAJ working range (a stated planning view, not survey or client data) (AAJ's stated planning view for B2B SaaS, Pre-Seed to Enterprise; not survey or client data, 2026) — AAJ's working range for Series B companies: 12–20% of revenue spent on marketing. Built from: AAJ's stated planning view, set against the published anchors in the Marketing Budget Benchmarks 2026 report (Gartner's 2026 CMO Spend Survey, The CMO Survey 2026 and SaaS Capital's 2026 spending benchmarks); expressed of revenue. Illustrative arithmetic from this band, not observed data: Illustrative: $15M revenue × 12–20% = $1.8M–$3M a year
- AAJ working range (a stated planning view, not survey or client data) (AAJ's stated planning view for B2B SaaS, Pre-Seed to Enterprise; not survey or client data, 2026) — AAJ's working range for scaling / post-Series B companies: 15–25% of revenue spent on marketing. Built from: AAJ's stated planning view, set against the published anchors in the Marketing Budget Benchmarks 2026 report (Gartner's 2026 CMO Spend Survey, The CMO Survey 2026 and SaaS Capital's 2026 spending benchmarks); expressed of revenue. Illustrative arithmetic from this band, not observed data: Illustrative: $40M revenue × 15–25% = $6M–$10M a year
- AAJ working range (a stated planning view, not survey or client data) (AAJ's stated planning view for B2B SaaS, Pre-Seed to Enterprise; not survey or client data, 2026) — AAJ's working range for mature and enterprise B2B SaaS companies: 5–7% of revenue spent on marketing, marketing only. Built from: AAJ's stated planning view, set against the published anchors in the Marketing Budget Benchmarks 2026 report (Gartner's 2026 CMO Spend Survey, The CMO Survey 2026 and SaaS Capital's 2026 spending benchmarks); expressed of revenue. Illustrative arithmetic from this band, not observed data: Illustrative: $200M revenue × 5–7% = $10M–$14M a year
- SaaS Capital , 2026 Spending Benchmarks for Private B2B SaaS Companies (1,000+ private B2B SaaS companies, fifteenth annual survey, March 2026) — Median marketing spend at private B2B SaaS companies is 8% of ARR.
- Gartner , 2026 CMO Spend Survey (401 CMOs across North America, the UK and Europe, most at companies above $1B revenue, January-March 2026) — Marketing budgets averaged 7.8% of company revenue in 2026, up from 7.7% in both 2024 and 2025.
Last verified 16 Sept 2026 · next review 15 Dec 2026 · 6 figures maintained in the Benchmark Library
What this resource helps you do
Size, allocate, track and forecast your marketing spend — with AAJ's stage bands, a CAC ceiling from your own unit economics, an automatic expense tracker, ROI verdicts, and a new-ARR forecast.
Get the planner from AAJ's free marketing templates library.
More in Analytics, Experiments & Budget
Part of the Analytics, Experiments & Budget hub - see all 35 resources on this topic.
- Playbook: Analytics & Attribution Playbook
- Article: How Much Should a Startup Spend on Marketing? Budget Ranges by Stage
- Article: Incrementality Testing for Startups: Prove Your Ads Actually Work (2026 Guide)
- Free tool: Marketing Budget Calculator
Also useful in Paid Media.